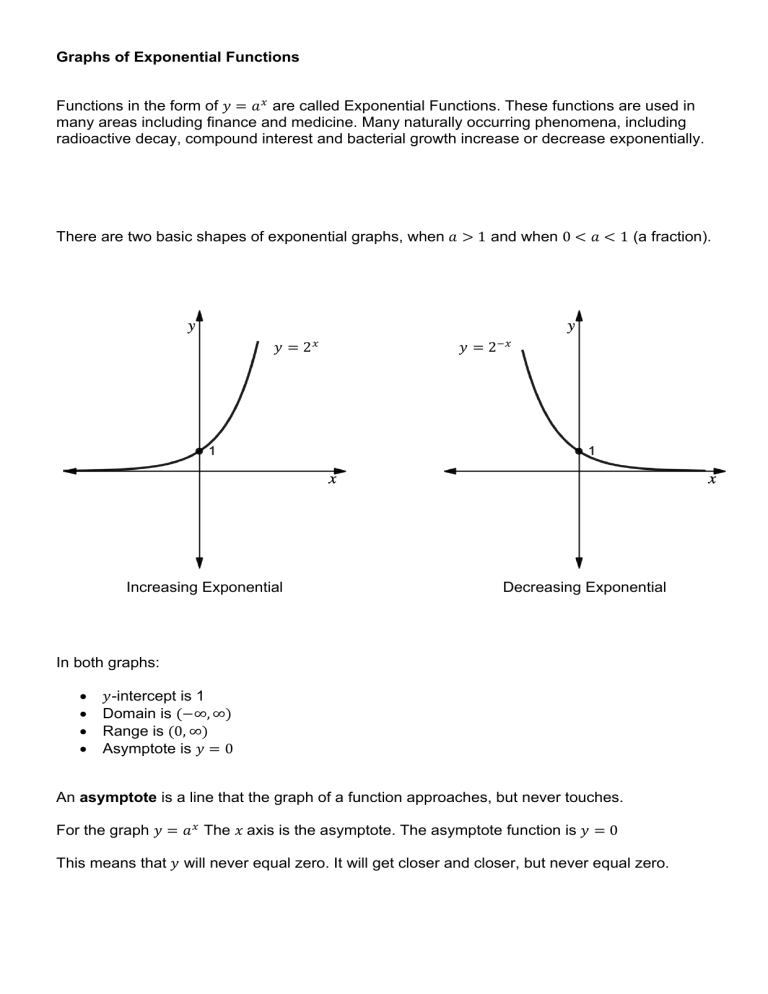
Graphs of Exponential Functions Functions in the form of 𝑦 = 𝑎 ! are called Exponential Functions. These functions are used in many areas including finance and medicine. Many naturally occurring phenomena, including radioactive decay, compound interest and bacterial growth increase or decrease exponentially. There are two basic shapes of exponential graphs, when 𝑎 > 1 and when 0 < 𝑎 < 1 (a fraction). 𝑦 = 2! Increasing Exponential 𝑦 = 2"! Decreasing Exponential In both graphs: • • • • 𝑦-intercept is 1 Domain is (−∞, ∞) Range is (0, ∞) Asymptote is 𝑦 = 0 An asymptote is a line that the graph of a function approaches, but never touches. For the graph 𝑦 = 𝑎 ! The 𝑥 axis is the asymptote. The asymptote function is 𝑦 = 0 This means that 𝑦 will never equal zero. It will get closer and closer, but never equal zero. Reflections of Exponential Functions Reflection on the 𝑦 axis The graph of 𝑦 = 2"! is a reflection of the graph 𝑦 = 2! on the 𝑦 axis. In other words, the power, −𝑥 is a reflection of 𝑥. 𝑦 = 2! 𝑦 = 2"! Reflection on the 𝑥 axis The graph of 𝑦 = −2! is a reflection of the graph 𝑦 = 2! on the 𝑥 axis. 𝑦 = 2! 𝑦 = −2! Translations Horizontal translations of exponential functions The graph of 𝑦 = 𝑎 !#$ is found by translating 𝑦 = 𝑎 ! 𝑖𝑓 𝑏 < 0 , 𝑖𝑓 𝑏 > 0, b units to the right b units to the left For example: 𝑦 = 2!#% ! Graph 𝑦 = 2 then translate 2 units to the left 𝑦 = 2!#% For example : 𝑦 = 2!"& Graph 𝑦 = 2! then translate 4 units to the right Vertical translations of exponential functions The graph of 𝑦 = 𝑎 ! + 𝑐 is found by translating 𝑦 = 𝑎 ! If 𝑐 < 0 (negative), c units down If 𝑐 > 0 (positive), c units up For example: 𝑦 = 2! + 3 𝑦 = 2! + 3 Graph 𝑦 = 2! then translate 2 units up For example 𝑦 = 2! − 5 𝑦 = 2! Graph 𝑦 = 2! then translate 2 units down 𝑦 = 2! − 5 𝑦 = 2! 𝑦 = 2!"& 𝑦 = 2#! Dilation When 𝑎 > 0 the graph gets steeper When 𝑎 < 0 the graph gets flatter 𝑦 = 2! " 𝑦 = 2#! Examples Start with the base graph, 𝑦 = 2! , 𝑦 = 3! , 𝑦 = 4! , To graph 𝑦 = 2! : 𝑥 -2 -1 0 1 2 3 𝑦 1 4 1 2 1 2 4 8 The asymptote for this graph is 𝑦 = 0 Once you know the shape of the graph, just 2 - 3 points will do, say 𝑥 = 0 , 𝑥 = 1 and 𝑥 = 2. Any number to the power of 𝑥 will give the same kind of graph. The y intercept will always be 𝑦 = 1 𝑦 = 2! Example 1 Graph 𝑦 = 3!#% showing the asymptote for the function and state the domain and range. From 𝑦 = 3! , 𝑦 = 3!#% will translate 3 units to the left 𝑦 = 3! The asymptote is 𝑦 = 0 The 𝑦 intercept, when 𝑥 = 0 𝑦 = 3!$% 𝑦 = 3'#% 𝑦 = 3% ∴𝑦=9 The domain is(−∞, ∞) and the range is (0, ∞) Example 2 Graph 𝑦 = 2!#( − 5, showing the asymptote for the function and state the domain and range. From 𝑦 = 2! , 𝑦 = 2!#( − 5 will translate 3 units to the left 5 units down 𝑦 = 2! The asymptote is 𝑦 = −5 The 𝑦 intercept, when 𝑥 = 0 𝑦 = 2'#( − 5 𝑦 = 2( − 5 𝑦 =8−5 ∴𝑦=3 The domain is (−∞, ∞) and the range is (−5, ∞) 𝑦 = 2!$% − 5 Example 3 Graph 𝑦 = 2!"( + 2 showing the asymptote for the function and state the domain and range. From 𝑦 = 2! , 𝑦 = 2!"( + 2 will translate 3 units to the right 2 units up The asymptote is 𝑦 = 2 The 𝑦 intercept, when 𝑥 = 0 𝑦 = 2'"( + 2 𝑦 = 2"( + 2 1 𝑦 = +2 8 ∴𝑦= 9 1 = (2 ) 8 8 The domain is (−∞, ∞) and the range is (2, ∞) 𝑦 = 2! 𝑦 = 2!&% + 2

