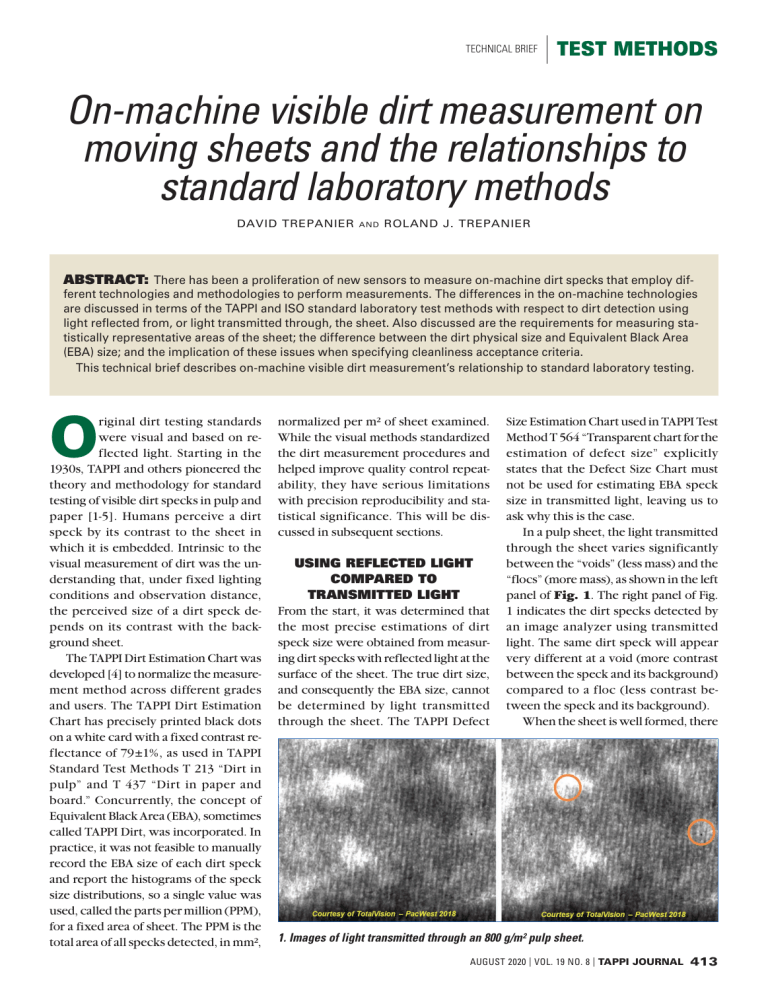
TECHNICAL BRIEF TEST METHODS On-machine visible dirt measurement on moving sheets and the relationships to standard laboratory methods DAVID TREPANIER and ROLAND J. TREPANIER ABSTRACT: There has been a proliferation of new sensors to measure on-machine dirt specks that employ different technologies and methodologies to perform measurements. The differences in the on-machine technologies are discussed in terms of the TAPPI and ISO standard laboratory test methods with respect to dirt detection using light reflected from, or light transmitted through, the sheet. Also discussed are the requirements for measuring statistically representative areas of the sheet; the difference between the dirt physical size and Equivalent Black Area (EBA) size; and the implication of these issues when specifying cleanliness acceptance criteria. This technical brief describes on-machine visible dirt measurement’s relationship to standard laboratory testing. O riginal dirt testing standards were visual and based on reflected light. Starting in the 1930s, TAPPI and others pioneered the theory and methodology for standard testing of visible dirt specks in pulp and paper [1-5]. Humans perceive a dirt speck by its contrast to the sheet in which it is embedded. Intrinsic to the visual measurement of dirt was the understanding that, under fixed lighting conditions and observation distance, the perceived size of a dirt speck depends on its contrast with the background sheet. The TAPPI Dirt Estimation Chart was developed [4] to normalize the measurement method across different grades and users. The TAPPI Dirt Estimation Chart has precisely printed black dots on a white card with a fixed contrast reflectance of 79±1%, as used in TAPPI Standard Test Methods T 213 “Dirt in pulp” and T 437 “Dirt in paper and board.” Concurrently, the concept of Equivalent Black Area (EBA), sometimes called TAPPI Dirt, was incorporated. In practice, it was not feasible to manually record the EBA size of each dirt speck and report the histograms of the speck size distributions, so a single value was used, called the parts per million (PPM), for a fixed area of sheet. The PPM is the total area of all specks detected, in mm², normalized per m² of sheet examined. While the visual methods standardized the dirt measurement procedures and helped improve quality control repeatability, they have serious limitations with precision reproducibility and statistical significance. This will be discussed in subsequent sections. USING REFLECTED LIGHT COMPARED TO TRANSMITTED LIGHT From the start, it was determined that the most precise estimations of dirt speck size were obtained from measuring dirt specks with reflected light at the surface of the sheet. The true dirt size, and consequently the EBA size, cannot be determined by light transmitted through the sheet. The TAPPI Defect Size Estimation Chart used in TAPPI Test Method T 564 “Transparent chart for the estimation of defect size” explicitly states that the Defect Size Chart must not be used for estimating EBA speck size in transmitted light, leaving us to ask why this is the case. In a pulp sheet, the light transmitted through the sheet varies significantly between the “voids” (less mass) and the “flocs” (more mass), as shown in the left panel of Fig. 1. The right panel of Fig. 1 indicates the dirt specks detected by an image analyzer using transmitted light. The same dirt speck will appear very different at a void (more contrast between the speck and its background) compared to a floc (less contrast between the speck and its background). When the sheet is well formed, there 1. Images of light transmitted through an 800 g/m² pulp sheet. AUGUST 2020 | VOL. 19 NO. 8 | TAPPI JOURNAL 413 TECHNICAL BRIEF TEST METHODS 2. A 200 g/m² photographic paper with 16 printed dots at 0.1 mm². remain issues with the transmitted light, as a dirt speck image can become diffused as it passes through a sheet. Figure 2 presents an example where 16 black dots, each 0.1 mm², were printed on the top side of a 200 g/m² wellformed photographic paper. The right and left panel view the dots from the top side with reflected and transmitted light, respectively. The middle panel views the dot from the bottom side using transmitted light. The dots in the middle panel appear larger and with less contrast compared to the right and left panels. As the right panel has less background variation in reflected light, it will thus have less variation in the size of the 16 identical dots compared to the left panel that is using transmitted light where the dots occur over flocs and voids with differing background contrast. Figure 3 presents three images of a large (0.8 mm²) speck on the top side of an 800 g/m² bleached pulp sheet. The diffusing effect of the thick pulp sheet causes the speck to disappear in the center panel when transmitted light is used. The previously referenced figures demonstrate how the use of transmitted light will cause incorrect measurement of the physical (true) size of specks and 3. An 800 g/m² bleached pulp sheet with 1 speck at 0.8 mm². 414 TAPPI JOURNAL | VOL. 19 NO. 8 | AUGUST 2020 subsequently the incorrect determination of the EBA (TAPPI) size. Furthermore, dirt specks within the thickness of the sheet or on the opposite surface to the viewing side will be missed, depending on the speck’s size and opacity, when using transmitted light. In fact, detecting 100% of dirt specks with transmitted light is not feasible. As reflected light provides the most accurate size measurement, it has remained the standard method for both visual and laboratory instrumental methods, including TAPPI Standard Test Method T 563 “Equivalent Black Are (EBA) and count of visible dirt specks in pulp, paper, and TECHNICAL BRIEF TEST METHODS paperboard by image analysis” and ISO Standard 5350-4 “Pulps—Estimation of dirt and shives—Part 4: Instrumental inspection by reflected light using Equivalent Black Area (EBA) method.” Fortunately, the proper application of dirt counting statistics will ensure that adequate material is analyzed to obtain statistically meaningful results. These statistics are applicable to both transmitted and reflected light analysis, whether employing visual or instrumental methods. DIRT COUNTING STATISTICS Whether the measurement of dirt is made visually or by image analysis, it may remain frustratingly imprecise. This occurs even when the people and the instruments perform perfectly, leaving us to examine why. Counting dirt specks is best described by Poisson Statistics [6,7], as in Eq. 1: 4. A classical Poisson distribution of particle counts for a range of sizes. (1) 5. Equivalent Black Area (EBA) effect. where N is the number of specks detected in a known area and n corresponds to the bin size. A typical probability distribution arising from Eq. 1 is given in Fig. 4. For Poisson-type distributions, the standard deviation is: (2) The degree of uncertainty (i.e., %-coefficient of variation) is defined as: (3) Eq. 3 reveals that the precision of the count is limited by the number of specks counted and not by the area of paper examined. Consequently, when paper is very clean, more area must be examined to achieve the same level of precision as with a dirtier paper. For example, if we measure 100 specks in 1 m², then we have an uncertainty of ± 10%. If the pulp is cleaned to remove 99% of the dirt such that we now have only 1 speck per m², then we must now measure 100 m², for a total of 100 specks detected, to achieve the same ± 10% uncertainty. The degree of uncertainty is important, as it defines the ultimate precision of a dirt count analysis, whether it is made by image analysis or visual testing. The most recent TAPPI and ISO visual dirt test methods, TAPPI T 213, TAPPI T 437, and ISO 5350, now require the reporting of the degree of uncertainty. DIFFERENCE BETWEEN PHYSICAL DIRT SPECK SIZE AND EBA DIRT There is much confusion about physical dirt size and EBA (TAPPI) dirt size. Various dirt inspection technologies often claim to report TAPPI Dirt when they are in fact reporting the physical size of a dirt speck. These are two different values and are applied differently in a production environment. Figure 5 presents 3 sets of 16 dots of equal size. The dots on the right and left have a contrast of 80%, which is comparable to the dot contrast of the TAPPI Dirt Estimation Chart. The 16 dots on the right are 1/4 the size of the dots on the left side. The gray set of dots in the middle are at 20% contrast, but they are the same physical size as the large black dots on the left. When viewed at arm’s length, the dots in the middle are closer in appearance to the dots on the right as compared to the dots on the left. The EBA/TAPPI Dirt results are used in making pulp and paper grade specifications for shipping product, as these measurements relate to what can be seen by the human eye when using the TAPPI Dirt Estimation Chart in TAPPI Test Methods T 213 and T 437. However, these results may not be useful enough for optimizing production cleaning equipment, which removes contaminants on the basis of particle size and mass, not its color or visual contrast. The development of image analysis technology provides the ability to measure both physical and EBA size. AUGUST 2020 | VOL. 19 NO. 8 | TAPPI JOURNAL 415 TECHNICAL BRIEF TEST METHODS DIRT SPECK MEASUREMENT IMAGE ANALYSIS Image analyzers, whether laboratory instruments or on-machine sensors, measure the physical size of dirt specks. The accuracy of the measurement is a function of both the optical resolution and sensitivity of the sensor. Virtually all commercial image analyzers can measure beyond the sensitivity and acuity of human vision. However, the image analysis sensitivity units, called gray levels, are arbitrary and require rescaling to units more commonly used in the pulp and paper industry. On this basis, the image analysis theory and mathematics for accurately determining dirt speck physical size and calculating EBA were developed [7-9] in the early 1980s. It was first implemented in TAPPI T 563 in the early 1990s and subsequently ISO 5350-4 nearly a decade later. Another advantage of image analysis technology is the possibility of quantifying both of the important dirt speck measurement attributes: the PPM and the number of specks per m². The visual standard methods only considered the PPM. This is problematic, as two sheets with the same PPM can have very different dirt speck size distributions. For example, consider the images in Fig. 6. In the right image, there are 60 dots of 0.08 mm² each for a total PPM of 4.8. The single large dot in the left image also has a PPM of 4.8. Though each image has the same PPM, the large single large dot is more visible and correspondingly more objectionable. ON-MACHINE DIRT INSPECTION Pioneering work at FPInnovations (Pointe-Claire, QC, Canada) found that dirt specks originating in the stock occur randomly in the sheet. If the dirt doubled on one side, it did so on the other side and throughout the thickness of the sheet in the case of thick pulp sheets. This supported the earlier work in development of the TAPPI Standard Test Methods [1-5], which use reflected light and sheet surface inspection. In order to make meaningful sheet cleanliness specifications, reliable labo416 6. These specks have the same parts per million (PPM) of specks, but a very different number of specks per m2. ratory standard methods were developed using image analysis employing the EBA concept. These standard methods are adequate to monitor the average cleanliness if there is enough dirt in the sample taken from the process to obtain reliable statistics. However, the laboratory standard methods are not adequate to catch short term dirt outbreaks [10] or when testing very clean sheets where the amount of sheet area that has to be inspected is prohibitively large. The desire for an on-machine dirt speck analysis system to confidently ship by gauge is very strong. Developing the laboratory imaging system, for which there are proven standard methods with specified calibration procedure and traceable calibration standards, into an on-machine application was achieved [10]. The first installation has been in continuous operation for over two years at West Fraser Pulp in Hinton, AB, Canada [11]. The Hinton mill produces 380,000 metric tons/year of northern bleached softwood kraft (NBSK) pulp, primarily from lodgepole pine and white spruce. The sensor is installed on a cross-machine direction (CD) scanner that traverses the pulp sheet every 45 s. The mill installation measures physical size and EBA size according to TAPPI T 563 and ISO 5350-4. This requires measurement by ref lected light—the calculation of EBA from the physical size as prescribed by the standard methods—with calibration plates that are traceable to ISO level II facilities. This allows mills to ship by gauge with high confidence. TAPPI JOURNAL | VOL. 19 NO. 8 | AUGUST 2020 After two years of operation, the observations from this installation include: • The average CD dirt profile is relatively flat. When there is a dirt outbreak, it occurs across the full width of the sheet at the same time (like waves breaking on a beach). This makes sense, as dirt specks in pulp randomly occur both in the thickness and width of the sheet. For dirt to occur in a single CD position would require that it be deposited on the sheet after it has formed in the press section and/or dryer section. While this may occur, it appears to be extremely rare. • The physical size of the dirt specks, along with aspect ratio, is used to differentiate shives from other contaminants. Also, the start of dirt outbreaks is observed in the physical size results before a change is observed in the TAPPI EBA. This occurs when the dirt initially is low contrast and very small and consequently not detected visually. The physical size results are used to monitor cleaning operations and the TAPPI EBA results are used for grade shipping specifications. • T he PPM, number of specks per m², and %Uncertainty is monitored for both physical size and TAPPI EBA. • M ill operators can reduce the amount of “out-of-spec” rejected bales by knowing exactly when a dirt outbreak starts and finishes. When using an on-machine dirt inspector, it has been observed that TECHNICAL BRIEF when a dirt outbreak occurs, the number of “out-of-spec” rejected bales can be reduced by up to 66% [14]. CONCLUSIONS Measuring visible dirt on-machine with reflected light is more accurate and can be performed in a way that meets the requirements of TAPPI and ISO standards, allowing for shipping by gauge according to official standard test methods. The randomness of dirt speck distribution in sheets does not necessitate that 100% of the sheet area be examined. TJ LITERATURE CITED 1. Clark, J.d’A., von Hazmburg, R.S., and Knoll, R.J., “The estimation of dirt and shives in pulp and paper,” Pap. Trade J. 96(5): 40(1933). 2. Clark, J.d’A., “Method of estimating the dirt in pulp and paper,” Tech. Assoc. Pap. 16(1): 347(1933); Pap. Trade J. (29 June 1933); Pap. Maker 86(4): TS188(1933). 3. Clark, J.d’A., “An improved measure of dirt in pulp and paper,” Tappi 42(7): 173A(1959). 4. Graff, J.H. and Nihlen, E.K., “A chart for the estimation of dirt in pulp and paper,” Tech. Assoc. Pap. 25: 331(1942); Pap. Trade J. 114(21): 61(1942). 5. TAPPI, “Dirt in paper,” Proposed revision of TAPPI Tentative Standard T 437, Tappi 46(3): 131A(1963). 6. Trepanier, R.J., Tappi J. 72(12): 153(1989) 7. Jordan, B.D., “Interpretation of dirt counts,” TAPPI Workshop on Image Analysis, TAPPI Press, Peachtree Corners, GA, USA, 1992. 8. Jordan, B.D., Nguyen, N.G., and Bidmade, L., Pulp Pap. Can. 84(6): TR60(1983) 9. Jordan, B.D. and Nguyen, N.G., J. Pulp. Pap. Sci. 11(3): J73(1985). TEST METHODS ABOUT THIS TECHNICAL BRIEF Cite this article as: Trepanier, D. and Trepanier, R.J., TAPPI J. 19(8): 413(2020). https://doi.org/10.32964/TJ19.8.413 DOI: https://doi.org/10.32964/TJ19.8.413 ISSN: 0734-1415 Publisher: TAPPI Press Copyright: ©TAPPI Press 2020 About this journal ABOUT THE AUTHOR D. Trepanier is R&D specialist and R.J. Trepanier is president at OpTest Equipment Inc., Hawkesbury, ON, Canada. Email R.J. Trepanier at trepanier@optest.com. D. Trepanier R.J. Trepanier 10. Trepanier, R.J. and Boese, J., “Pulp mill installation and operation of standardized on-machine visible dirt,” TAPPI PEERS Conf., TAPPI Press, Peachtree Corners, 2017. 11. Trepanier, R.J. and Boese, J., “Standardized on-machine dirt inspection at Hinton Pulp,” PACWEST Conf., PAPTAC, Brossard, QC, Canada, 2018. AUGUST 2020 | VOL. 19 NO. 8 | TAPPI JOURNAL 417


