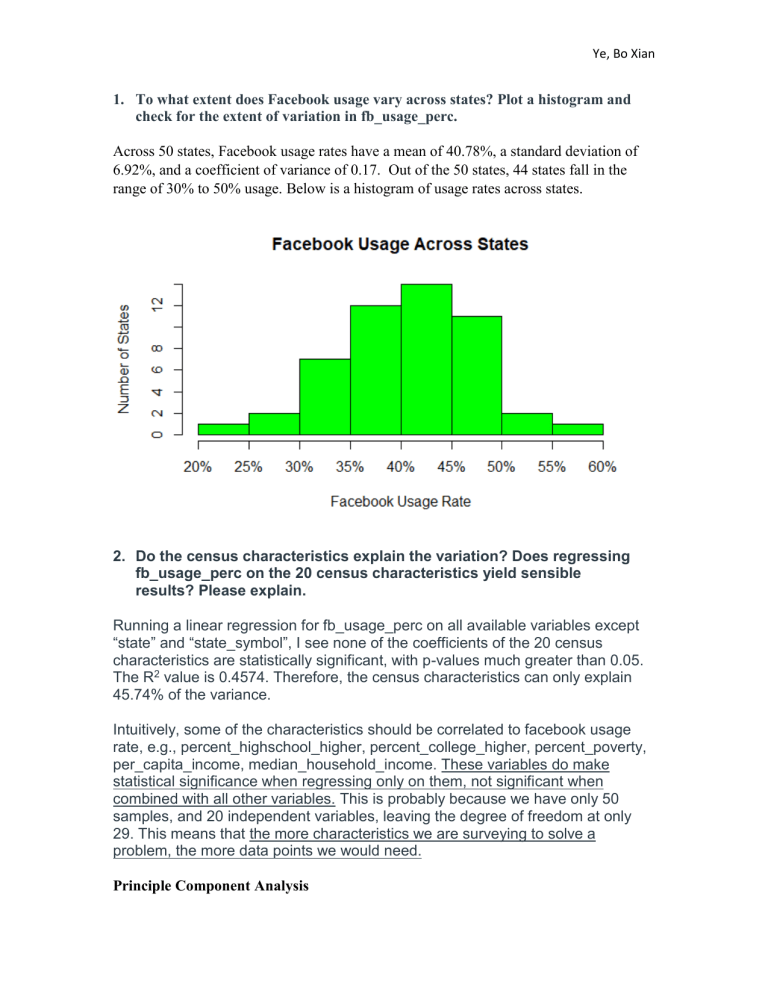
Ye, Bo Xian 1. To what extent does Facebook usage vary across states? Plot a histogram and check for the extent of variation in fb_usage_perc. Across 50 states, Facebook usage rates have a mean of 40.78%, a standard deviation of 6.92%, and a coefficient of variance of 0.17. Out of the 50 states, 44 states fall in the range of 30% to 50% usage. Below is a histogram of usage rates across states. 2. Do the census characteristics explain the variation? Does regressing fb_usage_perc on the 20 census characteristics yield sensible results? Please explain. Running a linear regression for fb_usage_perc on all available variables except “state” and “state_symbol”, I see none of the coefficients of the 20 census characteristics are statistically significant, with p-values much greater than 0.05. The R2 value is 0.4574. Therefore, the census characteristics can only explain 45.74% of the variance. Intuitively, some of the characteristics should be correlated to facebook usage rate, e.g., percent_highschool_higher, percent_college_higher, percent_poverty, per_capita_income, median_household_income. These variables do make statistical significance when regressing only on them, not significant when combined with all other variables. This is probably because we have only 50 samples, and 20 independent variables, leaving the degree of freedom at only 29. This means that the more characteristics we are surveying to solve a problem, the more data points we would need. Principle Component Analysis Ye, Bo Xian Due to lack of data points and degree of freedom, we should conduct PCA to eliminate multicollinearity. The PCA reduced the 20-multivariant problem down to 4 principle components that have eigenvalues greater than 1. Then, we run regressions for the 50 rows on only the 4 principle components. This produces statistical significance on 2 of the 4 principle components. Appendix. R Code FB=read.csv("FB_usage_by_states_data.csv") hist_info <- hist(FB$FB_usage_perc, plot=FALSE) plot(hist_info, xaxt="n", main="Facebook Usage Across States", xlab="Facebook Usage Rate", ylab="Number of States", col="green") axis(side=1, at=hist_info$breaks, labels = paste0(100*H$breaks, "%")) mean(FB$FB_usage_perc) sd(FB$FB_usage_perc) LRmodel1 = lm(FB_usage_perc ~ . - state - state_symbol, data=FB) summary(LRmodel1)


