Biology Exam: Contraception, Nervous System, Blood Sugar
advertisement
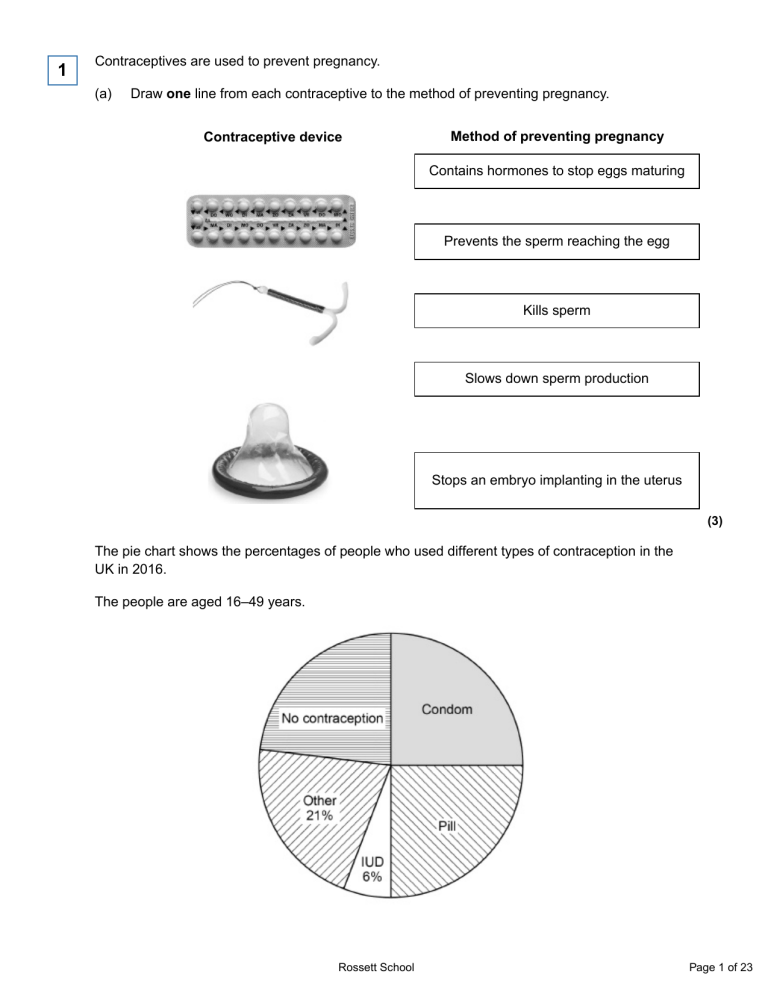
1 Contraceptives are used to prevent pregnancy. (a) Draw one line from each contraceptive to the method of preventing pregnancy. Contraceptive device Method of preventing pregnancy Contains hormones to stop eggs maturing Prevents the sperm reaching the egg Kills sperm Slows down sperm production Stops an embryo implanting in the uterus (3) The pie chart shows the percentages of people who used different types of contraception in the UK in 2016. The people are aged 16‒49 years. Rossett School Page 1 of 23 (b) Determine the percentage of people who used no contraception. ___________________________________________________________________ ___________________________________________________________________ ___________________________________________________________________ Percentage of people = ____________________ % (2) (c) Suggest two reasons why a person aged 16–49 years might not be using contraception. 1. _________________________________________________________________ ___________________________________________________________________ 2. _________________________________________________________________ ___________________________________________________________________ (2) The table shows some information about three methods of contraception. Method Combined pill Male condom Sterilisation Effectiveness 99.5% Other information • Must be taken every day • Free from your GP or sexual health clinic • May cause headaches • May split or leak • Only used when you have sexual intercourse • Inexpensive in supermarkets or free from a sexual health clinic • Needs an operation in hospital • Usually cannot be reversed 98.0% 100.0% Rossett School Page 2 of 23 (d) A man and a woman plan to start a family in 5 years’ time. Compare the risks and benefits for this couple of the three methods of contraception. ___________________________________________________________________ ___________________________________________________________________ ___________________________________________________________________ ___________________________________________________________________ ___________________________________________________________________ ___________________________________________________________________ ___________________________________________________________________ ___________________________________________________________________ ___________________________________________________________________ ___________________________________________________________________ (4) (Total 11 marks) 2 The diagram shows a reflex arc that moves the arm if the hand touches something hot. (a) Which part is the receptor? Tick one box. A B D F (1) Rossett School Page 3 of 23 (b) Which part is the effector of the reflex action? Tick one box. A B D F (1) (c) Which part shows a sensory neurone? Tick one box. B D E F (1) (d) Which part shows a synapse? Tick one box. A B D E (1) (e) Part C contains DNA. Which part of the nerve cell is C? Tick one box. Cell membrane Cytoplasm Mitochondrion Nucleus (1) (f) Reflex actions are automatic and do not involve thinking. Why is this an advantage? ___________________________________________________________________ ___________________________________________________________________ (1) Rossett School Page 4 of 23 (g) Which two factors can make you slower to react to a stimulus? Tick two boxes. Alcohol Caffeine Daylight Practice Tiredness (2) (Total 8 marks) 3 Car drivers need quick reactions to avoid accidents. A student uses a computer program to measure reaction time. The computer screen shows a traffic light on red. The traffic light then changes to green. The diagram below shows the change the person sees on the computer screen. When the traffic light changes to green the person has to click the computer mouse as quickly as possible. The computer program works out the time taken to react to the light changing colour. (a) Special cells detect the change in colour. (i) What word is used to describe special cells that detect a change in the environment? Draw a ring around the correct answer. (1) Rossett School Page 5 of 23 (ii) Where in the body are the special cells that detect the change in colour of the traffic lights? ______________________________________________________________ (1) (b) The student used the computer program on one computer to measure the reaction times of people of different ages. (i) Give one variable the student should control so that a fair comparison can be made between the people of different ages. ______________________________________________________________ ______________________________________________________________ (1) (ii) The student did each measurement three times to calculate a mean value. The table shows the results. Age in years Mean reaction time in milliseconds 15 242 30 45 221 60 258 75 364 90 526 The reaction times for the 30-year-old person were 192, 174 and 180 milliseconds. Calculate the mean reaction time of the 30-year-old person. ______________________________________________________________ ______________________________________________________________ Mean reaction time = ___________________ milliseconds (1) Rossett School Page 6 of 23 (iii) Which one of the following is an advantage of repeating each test three times and not doing the test just once? Tick (✔) one box. Any anomalies can be identified. The results will be more precise. There will be no errors. (1) (iv) Some people think that old people should not be allowed to drive a car. Why is it more dangerous for old people to drive cars? Use information from the table above to support your answer. ______________________________________________________________ ______________________________________________________________ ______________________________________________________________ ______________________________________________________________ (2) (Total 7 marks) Rossett School Page 7 of 23 4 Our nervous system controls our reactions. Figure 1 shows the part of the nervous system involved in the rapid response to a stimulus. Figure 1 (a) What is this type of rapid response called? Tick one box. Circular action Fast action Forced action Reflex action (1) Rossett School Page 8 of 23 (b) Features of the nervous system are labelled A, B, C, D and E on Figure 1. Draw one line from each feature to the correct label from Figure 1. Feature Label A Effector B Relay neurone C Sensory neurone D E (3) (c) Two students compare their reactions using a ruler. This is the method used. 1. Student A sits with his elbow on a table top. 2. Student B holds the ruler so the bottom of the ruler is level with the top of student A’s thumb. 3. Student B drops the ruler. 4. Student A catches the ruler. 5. Record the drop distance. 6. Repeat steps 1 to 5 four more times. 7. Repeat the whole experiment with student A dropping the ruler and student B catching it. Rossett School Page 9 of 23 Both students are right-handed. The students are testing the hypothesis: the drop distance of the ruler is smaller when a right-handed person uses their right hand to catch the ruler. Student A uses his right hand to catch the ruler. Student B uses her left hand to catch the ruler. Complete the sentence. Use an answer from the box. control dependent independent The drop distance was the ________________________________ variable. (1) Rossett School Page 10 of 23 (d) The table below shows the students’ results. Drop distance in cm Student Test 1 Test 2 Test 3 Test 4 Test 5 Student A 17.5 15.5 15.0 23.5 17.0 Student B 20.5 19.5 21.0 19.0 Figure 2 shows student B’s Test 2 result. Figure 2 Use Figure 2 to complete the missing result for Test 2. Write the answer in the table above. (1) Rossett School Page 11 of 23 (e) What was the resolution of the ruler the students used? Tick one box. 0.1 cm 0.5 cm 1 cm 10 cm (1) (f) One of the results in the table above is anomalous. Identify the anomalous result. Give the reason why you chose your answer. ___________________________________________________________________ ___________________________________________________________________ ___________________________________________________________________ (2) Rossett School Page 12 of 23 (g) The students are testing the hypothesis: the drop distance of the ruler is smaller when a right-handed person uses their right hand to catch the ruler. The results in the table above are not a good test of the hypothesis. What is one reason why? Tick one box. The drop distances are very variable The drop distance for Student A is sometimes bigger than the drop distance for Student B The results are for the left and right hands of different people The drop distances are not measured accurately enough (1) (Total 10 marks) 5 Blood sugar levels in the body are controlled by insulin. (a) How does insulin travel around the body? ___________________________________________________________________ ___________________________________________________________________ (1) Rossett School Page 13 of 23 (b) The table below shows the blood sugar levels for two people after eating a meal. Time after eating in hours Blood sugar levels in mg per 100 cm3 of blood Person A Person B 0 70 130 1 150 230 2 90 185 3 80 165 4 75 140 Use data from the table above to complete the graph in the figure below. Plot the points for person A. The first two points have been plotted for you. Draw a line through all the points. (3) (c) How long after the meal is person B’s insulin production at its peak? ___________________________________________________________________ ___________________________________________________________________ (1) Rossett School Page 14 of 23 (d) What is the greatest decrease in the blood sugar level of person B in an hour? ___________________________________________________________________ ___________________________________________________________________ ___________________________________________________________________ Decrease = ___________________ mg per 100 cm3 (2) (e) Estimate how long after eating the meal it will take for person B’s blood sugar level to return to the level before the meal. Show your working on the figure above. ___________________________________________________________________ ___________________________________________________________________ (2) (Total 9 marks) 6 A person with Type 1 diabetes does not produce enough of the hormone insulin. (a) Where is the hormone insulin produced? Tick one box. Brain Pancreas Pituitary Thyroid (1) (b) How does insulin travel around the body? ___________________________________________________________________ ___________________________________________________________________ (1) Rossett School Page 15 of 23 (c) The same concentration and volume of glucose solution was given to two people. • Person with Type 1 diabetes. • Person without Type 1 diabetes. The figure below shows how the blood glucose concentration of these two people changed after they each drank a glucose solution. Look at the figure above. Compare the blood glucose concentrations of the two people. Include similarities and differences in your answer. ___________________________________________________________________ ___________________________________________________________________ ___________________________________________________________________ ___________________________________________________________________ ___________________________________________________________________ ___________________________________________________________________ Rossett School Page 16 of 23 ___________________________________________________________________ ___________________________________________________________________ (4) (d) People with diabetes may be asked to control their diet. Explain how this can help to reduce the risk of developing health problems. ___________________________________________________________________ ___________________________________________________________________ ___________________________________________________________________ ___________________________________________________________________ ___________________________________________________________________ ___________________________________________________________________ (3) (Total 9 marks) Rossett School Page 17 of 23 Mark schemes 1 (a) 1 1 1 (b) 23% allow 1 mark for evidence of pill + condom = 180°/50% 2 (c) any two from: • want to have a baby • not having sex • past the menopause • pregnant allow any sensible reason 2 Rossett School Page 18 of 23 (d) Level 2: Scientifically relevant features are identified; the way(s) in which they are similar/different is made clear and (where appropriate) the magnitude of the similarity/difference is noted. 3-4 Level 1: Relevant features are identified and differences noted. 1-2 No relevant content 0 Indicative content combined pill • A – easy to take, very effective and free on NHS, but • D – it can cause headaches/side effects, must remember to take it every day condom • A – only need it when you have sex, no side effects, very inexpensive, but • D – it is not as reliable, more difficult to use sterilisation • A – 100% effective but • D – probably will not be able to have a family, risks of surgery 4 [11] 2 (a) A 1 (b) F 1 (c) B 1 (d) D 1 (e) nucleus 1 (f) (makes reactions) faster allow to reduce risk of damage / burns allow for protection / safety 1 Rossett School Page 19 of 23 (g) alcohol 1 tiredness 1 [8] 3 (a) (i) receptor cells 1 (ii) eye(s) accept retina 1 (b) (i) any one from: • gender / sex • quality of eyesight • eg wearing glasses eg of factor that might affect reaction times eg alcohol consumption / distractions / tiredness / health / time of day / amount of practice (at this test) do not allow time / age 1 (ii) 182 allow 182.0 1 (iii) Any anomalies can be identified. 1 (iv) reaction time (too) long or reactions (too) slow 1 allow reaction time (too) slow allow examples of data quoted or derived from the table, eg (mean) reaction time for 90 year olds is 162 ms longer than for 75 year olds (so) more likely to have / cause an accident 1 [7] 4 (a) Reflex action 1 Rossett School Page 20 of 23 (b) Feature Label extra lines from the left negate the mark 3 (c) dependent 1 (d) 17.0 allow answers in range 17.0–17.3 cm 1 (e) 0.5 cm 1 (f) 23.5 1 does not fit the pattern or at least 5 cm higher than the other values 1 (g) The results are for the left and right hands of different people 1 [10] 5 (a) in the blood(stream) allow plasma ignore dissolved or in solution 1 (b) all three plots correct accept two correct plots for 1 mark 2 suitable line drawn 1 (c) 1 hour 1 Rossett School Page 21 of 23 (d) 230−185 identification of steepest part of graph and correct readings taken 1 = 45 1 (e) line on graph showing extrapolation for person B correct value read from graph (at 130 mg per 100 cm3) allow 1 mark for a value of 4.5–5 hours if no extrapolation shown 2 [9] 6 (a) pancreas 1 (b) (in the) blood(stream) allow in the (blood) plasma 1 ignore dissolved or in solution (c) any two from: • • • concentration rises and falls in both people concentration is higher at start / always in person with diabetes concentration rises higher in person with diabetes allow correct use of figures 2 plus any two from: • • • • concentration rises more rapidly in person with diabetes concentration stays high for longer in person with diabetes concentration does not return to starting level during test in person with diabetes, yet concentration returns to starting concentration by 90 minutes in person without diabetes concentration goes below starting concentration only in person without diabetes 2 (d) reduce carbohydrate / glucose / sugar in diet 1 (so) blood glucose concentration does not increase as much 1 Rossett School Page 22 of 23 (so) there is reduced named effect (of prolonged high blood glucose) allow reduced short or long term consequences such as tiredness or increase urination or thirst or eye / kidney / nerve / heart disease 1 [9] Rossett School Page 23 of 23
