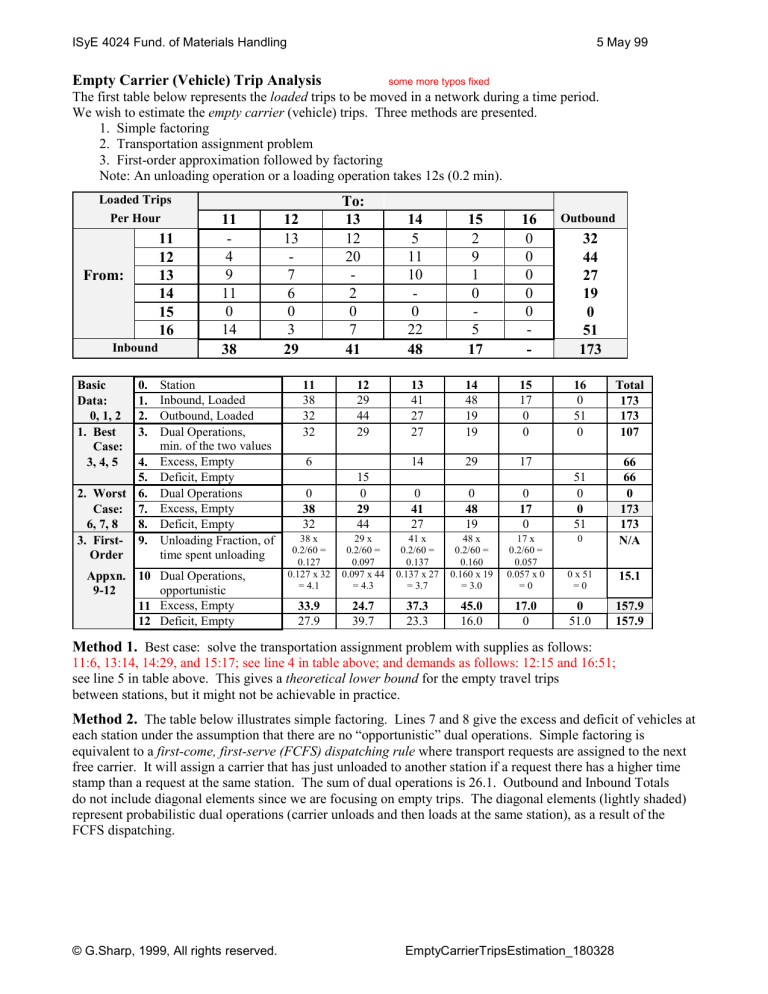
ISyE 4024 Fund. of Materials Handling 5 May 99 Empty Carrier (Vehicle) Trip Analysis some more typos fixed The first table below represents the loaded trips to be moved in a network during a time period. We wish to estimate the empty carrier (vehicle) trips. Three methods are presented. 1. Simple factoring 2. Transportation assignment problem 3. First-order approximation followed by factoring Note: An unloading operation or a loading operation takes 12s (0.2 min). Loaded Trips Per Hour 11 12 13 14 15 16 From: Inbound Basic Data: 0, 1, 2 1. Best Case: 3, 4, 5 0. 1. 2. 3. 4. 5. 2. Worst 6. Case: 7. 6, 7, 8 8. 3. First- 9. Order 11 4 9 11 0 14 38 Station Inbound, Loaded Outbound, Loaded Dual Operations, min. of the two values Excess, Empty Deficit, Empty Dual Operations Excess, Empty Deficit, Empty Unloading Fraction, of time spent unloading Appxn. 10 Dual Operations, opportunistic 9-12 11 Excess, Empty 12 Deficit, Empty To: 13 12 20 2 0 7 41 12 13 7 6 0 3 29 11 38 32 32 12 29 44 29 6 14 5 11 10 0 22 48 15 2 9 1 0 5 17 16 0 0 0 0 0 - 13 41 27 27 14 48 19 19 15 17 0 0 14 29 17 Outbound 32 44 27 19 0 51 173 16 0 51 0 Total 173 173 107 51 0 0 51 66 66 0 173 173 N/A 0 38 32 15 0 29 44 0 41 27 0 48 19 0 17 0 38 x 0.2/60 = 0.127 0.127 x 32 = 4.1 29 x 0.2/60 = 0.097 0.097 x 44 = 4.3 41 x 0.2/60 = 0.137 0.137 x 27 = 3.7 48 x 0.2/60 = 0.160 0.160 x 19 = 3.0 17 x 0.2/60 = 0.057 0.057 x 0 =0 0 x 51 =0 15.1 33.9 27.9 24.7 39.7 37.3 23.3 45.0 16.0 17.0 0 0 51.0 157.9 157.9 0 Method 1. Best case: solve the transportation assignment problem with supplies as follows: 11:6, 13:14, 14:29, and 15:17; see line 4 in table above; and demands as follows: 12:15 and 16:51; see line 5 in table above. This gives a theoretical lower bound for the empty travel trips between stations, but it might not be achievable in practice. Method 2. The table below illustrates simple factoring. Lines 7 and 8 give the excess and deficit of vehicles at each station under the assumption that there are no “opportunistic” dual operations. Simple factoring is equivalent to a first-come, first-serve (FCFS) dispatching rule where transport requests are assigned to the next free carrier. It will assign a carrier that has just unloaded to another station if a request there has a higher time stamp than a request at the same station. The sum of dual operations is 26.1. Outbound and Inbound Totals do not include diagonal elements since we are focusing on empty trips. The diagonal elements (lightly shaded) represent probabilistic dual operations (carrier unloads and then loads at the same station), as a result of the FCFS dispatching. © G.Sharp, 1999, All rights reserved. EmptyCarrierTripsEstimation_180328 ISyE 4024 Fund. of Materials Handling 2. Factoring after worst case: 11 12 From: 13 14 15 16 Inbound 5 May 99 To: 11 12 13 14 15 16 Outbound 32x38/173 = 7.0 32x29/173 = 5.4 32x41/173 = 7.6 32x48/173 = 8.9 32x17/173 = 3.1 32x0/173 = 0 44x38/173 = 9.7 44x29/173 = 7.4 44x41/173 = 10.4 44x48/173 = 12.2 44x17/173 = 4.3 44x0/173 = 0 27x38/173 = 5.9 27x29/173 = 4.5 27x41/173 = 6.4 27x48/173 = 7.5 27x17/173 = 2.7 27x0/173 =0 19x38/173 = 4.2 19x29/173 = 3.2 19x41/173 = 4.5 19x48/173 = 5.3 19x17/173 = 1.9 19x0/173 = 0 0x38/173 =0 0x29/173 =0 0x41/173 =0 0x48/173 =0 0x17/173 =0 0x0/173 = 0 51x38/173 = 11.2 51x29/173 = 8.5 51x41/173 = 12.1 51x48/173 = 14.2 51x17/173 = 5.0 51x0/173 =0 31.0 25 36.6 20.6 13.8 0 51 147 21.6 34.6 42.8 17.0 0 The table below illustrates Method 3, factoring after first-order approximation. The data used are from lines 10 – 12 in the first table. Lines 9 – 10 present the results of “opportunistic dual operations”; these occur when a carrier is unloading at a station and an outbound load arrives at that station (it would be foolish to send the carrier away empty). The sum of these opportunistic dual operations is 15.1/period. The remaining outbound requests are handled by the factoring (FCFS) method described earlier. The factoring method then results in an additional, 22.3 probabilistic dual operations (shown lightly shaded), for a total of (15.1 + 22.3) = 37.4 dual operations, involving no travel time. The Outbound and Inbound Totals in the table below ignore diagonal elements, since they do not involve travel. 3. Factoring after 1st Order Appxn. From: 12 14 15 0x33.9/ 157.9 = 0 11 39.7x33.9/ 27.9x33.9/ 157.9 = 8.5 157.9 = 6.0 23.3x33.9/ 157.9 = 5.0 16x33.9/ 157.9 = 3.4 12 27.9x24.7/ 157.9 = 4.4 27.9x37.3/ 157.9 = 6.6 27.9x45.0/ 157.9 = 8.0 27.9x17.0/ 157.9 = 3.0 27.9x0/ 157.9 = 0 39.7x24.7/ 157.9 = 6.2 23.3x24.7/ 157.9 = 3.6 16x24.7/ 157.9 = 2.5 39.7x37.3/ 157.9 = 9.4 23.3x37.3/ 157.9 = 5.5 16x37.3/ 157.9 = 3.8 39.7x45.0/ 157.9= 11.3 23.3x45.0/ 157.9 = 6.6 16x45.0/ 157.9 = 4.6 39.7x17.0/ 157.9 = 4.3 23.3x17.0/ 157.9 = 2.5 16x17.0/ 157.9 = 1.7 39.7x0/ 157.9 = 0 23.3x0/ 157.9 = 0 16x0/ 157.9 = 0 33.5 17.7 11.4 13 14 15 16 Inbound 11 To: 13 22 16 51x33.9/ 157.9 = 10.9 0x24.7/ 51x24.7/ 157.9 = 0 157.9 = 8.0 0x37.3/ 51x37.3/ 157.9 = 0 157.9 = 12.0 0x45.0/ 51x45.0/ 157.9 = 0 157.9 = 14.5 0x17.0/ 51x17.0/ 157.9 = 0 157.9 = 5.5 0x0/ 157.9 51x0/ 157.9 = 0 = 0 0 50.9 Outbound 27.8 18.5 31.8 40.4 17.0 0 135.5 Next step for any method: Multiply trip times by number of loaded and unloaded trips; add time for loading and unloading; allow for vehicle utilization less than 100%, vehicle downtime during operation, congestion, communication delays, etc. It is difficult to obtain vehicle utilization values above 90%, counting both loaded and unloaded travel. Typical values are below 85%. In practice, smart dispatching rules can out-perform Method 3. This method is an easy way to get a quick estimate of the empty travel in a system, when comparing technologies for material movement. Once a decision is made to adopt a technology, a detailed simulation should be performed to check performance under various operating conditions. © G.Sharp, 1999, All rights reserved. EmptyCarrierTripsEstimation_180328
