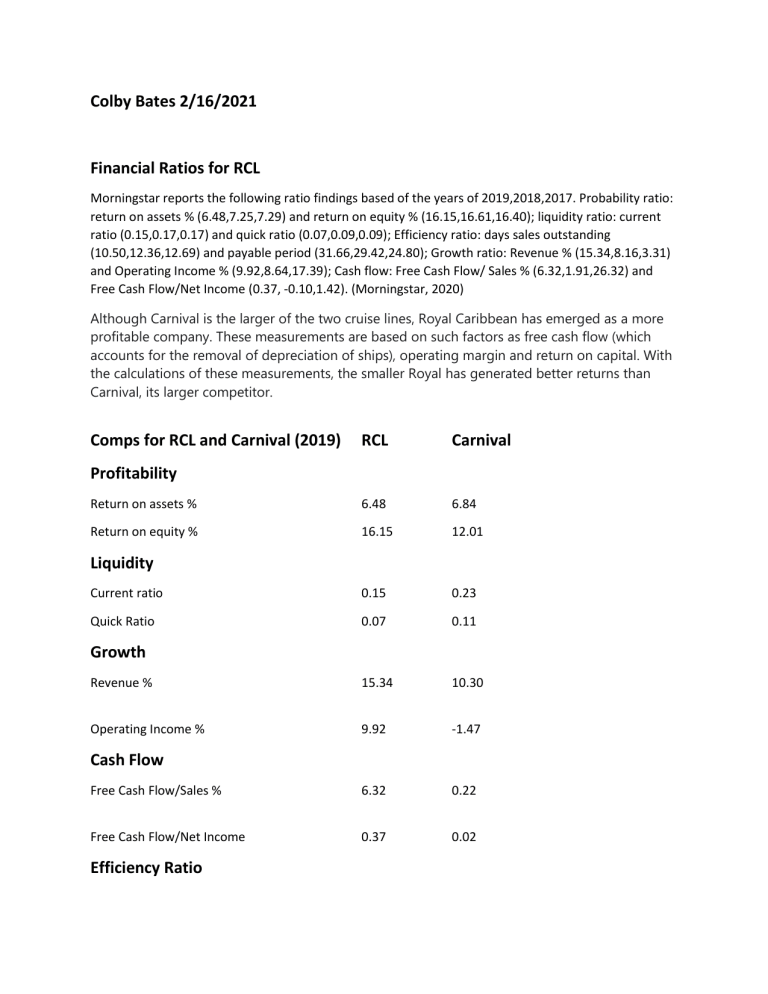
Colby Bates 2/16/2021 Financial Ratios for RCL Morningstar reports the following ratio findings based of the years of 2019,2018,2017. Probability ratio: return on assets % (6.48,7.25,7.29) and return on equity % (16.15,16.61,16.40); liquidity ratio: current ratio (0.15,0.17,0.17) and quick ratio (0.07,0.09,0.09); Efficiency ratio: days sales outstanding (10.50,12.36,12.69) and payable period (31.66,29.42,24.80); Growth ratio: Revenue % (15.34,8.16,3.31) and Operating Income % (9.92,8.64,17.39); Cash flow: Free Cash Flow/ Sales % (6.32,1.91,26.32) and Free Cash Flow/Net Income (0.37, -0.10,1.42). (Morningstar, 2020) Although Carnival is the larger of the two cruise lines, Royal Caribbean has emerged as a more profitable company. These measurements are based on such factors as free cash flow (which accounts for the removal of depreciation of ships), operating margin and return on capital. With the calculations of these measurements, the smaller Royal has generated better returns than Carnival, its larger competitor. Comps for RCL and Carnival (2019) RCL Carnival Return on assets % 6.48 6.84 Return on equity % 16.15 12.01 Current ratio 0.15 0.23 Quick Ratio 0.07 0.11 Revenue % 15.34 10.30 Operating Income % 9.92 -1.47 Free Cash Flow/Sales % 6.32 0.22 Free Cash Flow/Net Income 0.37 0.02 Profitability Liquidity Growth Cash Flow Efficiency Ratio Days sales outstanding 10.50 7.03 Payable period 31.66 21.01 Morningstar. (2020). Village Roadshow Limited. DatAnalysis Premium. Retrieved February 28, 2020, from https://datanalysis.morningstar.com.au
