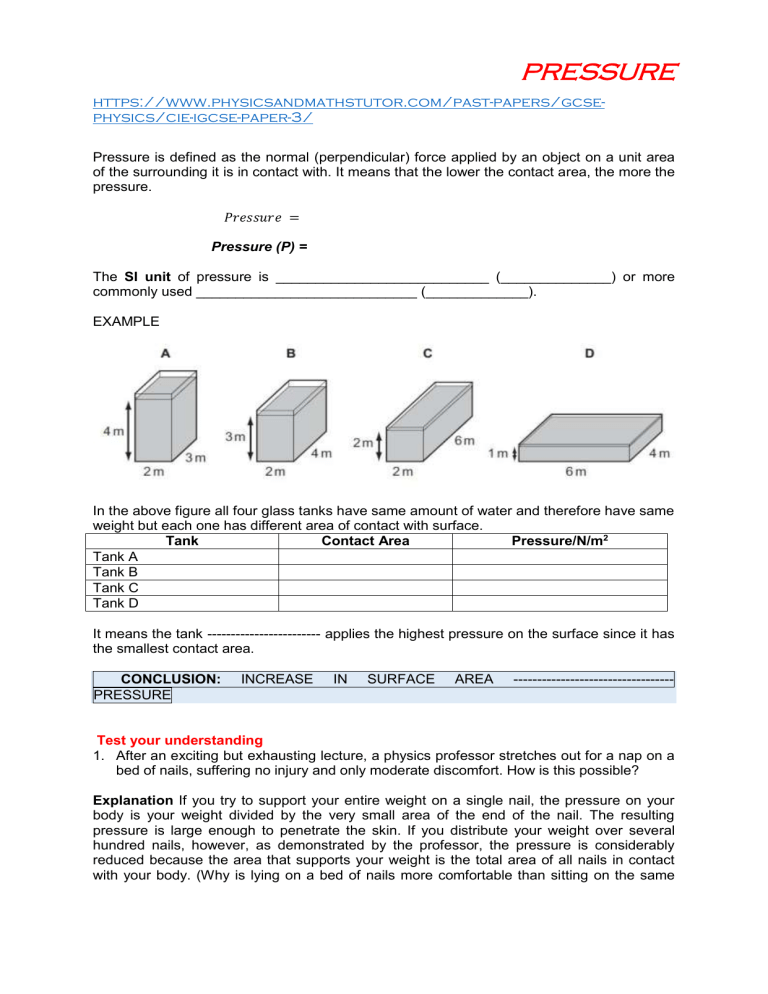
PRESSURE https://www.physicsandmathstutor.com/past-papers/gcsephysics/cie-igcse-paper-3/ Pressure is defined as the normal (perpendicular) force applied by an object on a unit area of the surrounding it is in contact with. It means that the lower the contact area, the more the pressure. 𝑃𝑟𝑒𝑠𝑠𝑢𝑟𝑒 = Pressure (P) = The SI unit of pressure is ___________________________ (______________) or more commonly used ____________________________ (_____________). EXAMPLE In the above figure all four glass tanks have same amount of water and therefore have same weight but each one has different area of contact with surface. Tank Contact Area Pressure/N/m2 Tank A Tank B Tank C Tank D It means the tank ------------------------ applies the highest pressure on the surface since it has the smallest contact area. CONCLUSION: PRESSURE INCREASE IN SURFACE AREA ---------------------------------- Test your understanding 1. After an exciting but exhausting lecture, a physics professor stretches out for a nap on a bed of nails, suffering no injury and only moderate discomfort. How is this possible? Explanation If you try to support your entire weight on a single nail, the pressure on your body is your weight divided by the very small area of the end of the nail. The resulting pressure is large enough to penetrate the skin. If you distribute your weight over several hundred nails, however, as demonstrated by the professor, the pressure is considerably reduced because the area that supports your weight is the total area of all nails in contact with your body. (Why is lying on a bed of nails more comfortable than sitting on the same bed? Extend the logic to show that it would be more uncomfortable yet to stand on a bed of nails without shoes.) 2. Explain: a) How you would cross a lake covered with thin ice without falling in ……………………………………………………………………………………………………. b) Why knives, pins, nails are sharp ………………………………………………………………………………………………………. 3. Fig. 3.1 shows a rectangular tank filled with water. The water exerts pressure on the base of the tank. The density of water is 1000 kg/m3 Fig.3.1 (a) What is meant by Pressure? …………………………………………………………………………………………………… ……………………………………………………………………………………………... [1] (b) Calculate the pressure exerted by the water on the base of the tank. pressure = ………………………….[2] (c) The water is transferred into another rectangular tank, which has a smaller base area. The two tanks have the same volume. (i) How will the pressure exerted by the Water on the base of the tank differ? ………………………………………………………………………………………………… Explain your answer. ………………………………………………………………………………………………… …………………………………………………………………………………………….. [2] (ii) Explain why the total force exerted by the Water on the base of the tank is the same. ……………………………………………………………………………………………… …………………………………….……………………..……………………………….[1] PRESSURE DUE TO LIQUID A liquid held in a container exerts pressure on the inner walls of the container as well as on any object that is inside the liquid. Following are the properties applied to any object in a liquid. 1. Pressure of liquid on an object acts equally in all directions, When the syringe is compressed, water will have the same range from all the outlets. 2. Pressure of liquid increase with the increase of depth, A B V C When the stoppers are removed at the same time, it is observed that water from the bottom hole (outlet) has the longest range. This is so because the height (depth) of water increases downward and this increases pressure as well. Pressure at C is greater than pressure at B and A. 3. Pressure depends upon the density of the liquid The liquid exert a force on the surface below due to its weight which depends on its density (ρ). 4. Pressure does not depend upon the shape of the container. When a fluid is at rest in a container, all portions of the fluid must be in static equilibrium— at rest with respect to the observer. Furthermore, all points at the same depth must be at the same pressure. If this were not the case, fluid would flow from the higher pressure region to the lower pressure region. Liquid flows from one tube to the other when there is pressure difference until pressure is the same in all the tubes. Liquid poured in a set Pascal vases is the demonstration that pressure depends on depth and density only and not on the shape of the vessel. When a set of tubes of different shapes are connected to a common source of water The pressure due to liquid of density ρ and height h can be expressed by: 𝒇𝒐𝒓𝒄𝒆 𝑷𝒓𝒆𝒔𝒔𝒖𝒓𝒆 (𝑷) = 𝒂𝒓𝒆𝒂 𝒎𝒈 = 𝒂𝒓𝒆𝒂 𝝆𝒗𝒈 𝑨 = 𝝆𝑨𝒉𝒈 𝑨 = 𝑷𝑹𝑬𝑺𝑺𝑼𝑹𝑬 = 𝑫𝒆𝒏𝒔𝒊𝒕𝒚 𝒙 𝑮𝒓𝒂𝒗𝒊𝒕𝒚 (𝒈) 𝒙 𝑯𝒆𝒊𝒈𝒉𝒕 (𝒉) P = 𝝆gh U TUBE MANOMETER Manometers are used to measure the pressure difference between two regions. It consists of a tube of plastic or glass, bent into the U-shape and filled with a liquid (often oil) that is displaced when the pressures at each end of the tube are different. One end of a U-shaped tube containing a liquid is open to the atmosphere, and the other end is connected to a system of unknown pressure P. If there is a pressure difference between the ends of the manometer, the liquid moves until the pressure difference is balanced by the difference in heights of the ends of the liquid. The greater the pressure, the greater the difference in heights The pressure at point B equals P0+ ρgh, where ρ is the density of the fluid. The pressure at B, however, equals the pressure at A, which is also the unknown pressure P. We conclude that: 𝑷 = 𝑷𝟎 + 𝝆𝒈𝒉. The pressure P is called the absolute pressure, and 𝑷 + 𝑷𝟎 is called the gauge pressure. Oil is often used rather than water because water evaporates and also oil is less dense which makes the manometer more sensitive. Test your understanding 1. Fig. 1.1 shows a water manometer used to measure the pressure inside a gas pipe. Fig 1.1 Fig 1.2 Fig 1.3 (a) State whether the pressure inside the gas pipe in Fig. 1.1 is larger than or smaller than atmospheric pressure. .................................................................................................................................. [1] (b) The manometers shown in Figs. 1.2 and 1.3 are connected to the same gas pipe at the same pressure as shown in Fig. 1.1. On Figs. 1.2 and 1.3, draw the levels of the liquid in each manometer if (i) the manometer in Fig. 1.2 contains water and has tubes with twice the diameter of Fig. 1.1, (ii) the manometer in Fig. 1.3 contains a liquid with density half that of water. [2] (c) The manometer shown in Fig. 2.4 has its top end sealed. Fig 1.4 Explain why the water levels are different in Figs. 1.4 and 1.1, even though the pressure in the gas pipe is the same. ....................................................................................................................................... ....................................................................................................................................... ....................................................................................................................................... .................................................................................................................................. [2] 2. A U-shaped tube, of constant cross-sectional area, contains some water of density 1000 kg / m3. Oil that does not mix with water is then poured into the right-hand side of the tube. Fig. 2.1 shows the levels of the water and the oil when equilibrium is reached. Fig. 2.1 Points X and Y are at the same horizontal level. X is 0.066 m below the top surface of the water. Y is 0.075 m below the top surface of the oil. (a) State two quantities that influence the pressure beneath the surface of a liquid ………………………………………………………………………………………………………. [2] (b) The cross-sectional area of the tube is 5.0 × 10⁻⁴ m2. (i) Calculate the mass of water above the level of X. mass …………………………………… [2] (ii) The pressure caused by 0.066 m of water at X is equal to that caused by 0.075 m of the oil at Y. Determine the density of the oil. density……………………………….[2] 3. A U-tube manometer is used to measure lung pressure by blowing at A, as shown in Fig. 3.1. Fig. 3.1 (i) Before the person blows at A, the liquid levels at X and Y are the same. State the reason for this. ...................................................................................................................................... (ii) Which way do the liquid levels move when the person blows at A? level X moves .............................................. level Y moves .............................................. [2] (iii) What would you measure in order to find the person's lung pressure? ................................................................................................................................................... .............................................................................................................................................. [4] 4. The manometer on an industrial machine below shows the oil is being pushed towards the machine and the height difference, h, is 20 cm. What is the pressure inside the machine if the pressure outside is 100 kPa? The oil has a density of 800 kg/m3 pressure ………………………….. [2] 5. A submarine is at rest deep beneath the surface of the sea. The gravitational field strength is 10 N/kg, the atmospheric pressure is 1.0 × 10⁵ Pa and the density of sea water is 1.0 x 10³ kg/m3 Calculate (i) the pressure due to the sea water at a depth of 120 m, pressure ………………………….. [2] (ii) the total pressure at a depth of 120 m. total pressure ………………………….. [1] 6. Calculate the pressure on the top lid of a chest buried under 4.00 meters of mud with density 1.75 x 10³ kg/m3 at the bottom of a 10.0-m-deep lake. Pressure ……………………………. [2] Atmospheric pressure Air pressure is the pressure exerted on all objects by the weight of the air above. Air pressure is dependent on altitude, because the higher the altitude, the less air is above, and as a result, the air pressure will be lower. We can measure air pressure by using a device called a barometer. One atmosphere of pressure is defined to be the pressure equivalent of a column of mercury that is exactly 0.76 m in height at 0°C with g =10 m/s2. At this temperature, mercury has a density of 13.595 x 10³ kg/m3; therefore, P0 = ρgh = (13.595 x10³ kg/m3) (10 m/s2) (0.760 0 m) = 1.013 x 10⁵ Pa = 1 atm 1 atm. = 76 cm Hg =760 mm Hg = 101.325kPa = 101325 Pa MERCURY BAROMETER It is a device used to measure the atmospheric pressure. It consists of a glass column of about 78 cm in height, closed at one end and open at the other. The space at the top of the tube is a vacuum (zero pressure).The open end is placed upside down inside a mercuryfilled container . Atmospheric pressure pushes down on the mercury in the reservoir, which in turn pushes mercury up the tube until the pressure of the column of mercury balances the atmospheric pressure. In other words, the height of the mercury in the column rises and adjusts until the weight of the mercury inside the column balances the atmospheric force due to air exerted on the mercury in the container. The height of the mercury column balances exactly at 76 cm which is equivalent to the atmospheric pressure outside the column. At sea level standard atmospheric pressure is 760 mm of mercury (= 101 300 Pa or 101 300 N/m2 though for simplicity we usually just use 100 000 Pa) Test your understand 1. Fig. 1.2 shows a simple mercury barometer. Fig.1.2 (i) Suggest which liquid is contained in the barometer. .................................................................................................................................. [1] (ii) What is region P? ……………………………………………………………………………………………… [1] (iii) Explain why it is not sensible to make a barometer with the liquid top reaching the top of the tube. ……………………………………..……………………………………………….………… ………………..……………………………………………………………………....……...[1] (iv) State the atmospheric pressure shown by the barometer. pressure……………………………...[1] (v) Calculate the length of the column of mercury at standard atmospheric pressure of 101 kPa? Density of mercury = 13546 kg/m3. Use g = 9.81 m/s2. pressure……………………………...[2] (vi) The atmospheric pressure increases. State one of the three marked distances that decreases. .................................................................................................................................. [1] (vii) State what would happen to this reading if the barometer is taken down into a valley. ………………………………………………..………………………………………………… …………………………………………….…….……………………………………………… (viii) Explain your answer ………………………………………………………………………………………………..… …………………………….…………………………………………………….……….[2] EFFECTS OF AIR PRESSURE 1. CAN CRASHING All the air is driven out by filling the can with steam. While the steam pressure is inside it balances the atmospheric pressure (air pressure) outside. When the steam condenses, the inside pressure falls. The much pressure outside crushes the can. 2. SUCKING UP A STRAW It is done by reducing pressure inside the mouth so that air pressure on the surface of the drink pushes it up the straw. 3. FILLING A SYRINGE The piston/plunger in the syringe is raised. This reduces the pressure below the piston. The atmospheric pressure then pushes liquid up into space inside a 4. PRESSURE SUCKER/RUBBER STICKER When the sucker is moistened and pressed on smooth surface, the air inside is pushed out. Atmospheric pressure then holds it firmly against the surface. Suckers are used for attaching car licenses to windscreens and lift metal sheets in industries WEATHER FORECAST Pressure is an important measurement in weather predictions. In general a steady rise in pressure is a sign of good weather and a rapid fall is a sign of bad weather Pressure in weather maps is given in millibars (mb). Normal atmospheric pressure at sea level is: 1000 mb = 1 bar = 100 000 Pa = 760 mmHg ISOBARS An isobar is a line drawn across a map that joins or links places of equal pressure. Pressure is measured in millibars and the isobars are often at intervals of 4mb. Charts showing isobars are useful because they can help to identify anticyclones and cyclones or depressions. Thus they are used to guide prediction of weather trends and give present situation. Closely spaced isobars indicate a big pressure difference over a short distance and suggest strong winds are likely and weather is highly unstable Widely spaced isobars show gradually steady pressure change and suggest light winds and stable. The wind will blow almost parallel to the isobars. Around an anticyclone the winds will blow slightly across the isobars, away from the centre of the anticyclone. In depressions, the wind will blow slightly across the isobars towards the centre of the low pressure. CYCLONES AND ANTICYCLONES A low pressure system is an area of pressure that is lower than the area surrounding its area. Low pressure winds flow in a counterclockwise rotation in the northern hemisphere. A low pressure system is also represented as a Big, red L on a weather map. 1………………………………………….. 2………………………………………………….. A high pressure system is the result of the shifting winds. High pressure winds flow in a clockwise rotation in the northern hemisphere and counterclockwise in the southern hemisphere. A high pressure system is also represented as a big, red H on a weather map. High-Pressure Wind Patterns: A high-pressure center is known as an anticyclone, and the flow of air associated with it is described as being anticyclonic. The four patterns of anticyclonic circulation are shown in Figure – In the upper atmosphere of the Northern Hemisphere, the winds move clockwise in a geostrophic manner parallel to the isobars. In the friction layer (lower altitudes) of the Northern Hemisphere, there is a divergent clockwise flow, with the air spiraling out away from the center of the anticyclone. In the upper atmosphere of the Southern Hemisphere, there is a counterclockwise, geostrophic flow parallel to the isobars. In the friction layer of the Southern Hemisphere, the pattern is a mirror image of the Northern Hemisphere, with air diverging in a counterclockwise pattern. Low-Pressure Wind Patterns: Low-pressure centers are called cyclones, and the associated wind movement is said to be cyclonic. As with anticyclones, Northern Hemisphere cyclonic circulations are mirror images of their Southern Hemisphere counterparts: In the upper atmosphere of the Northern Hemisphere, air moves counterclockwise in a geostrophic pattern parallel to the isobars. In the friction layer of the Northern Hemisphere, a converging counterclockwise flow exists. In the upper atmosphere of the Southern Hemisphere, a clockwise, geostrophic flow occurs paralleling the isobars. In the friction layer of the Southern Hemisphere, the winds converge in a clockwise spiral. High pressure systems Anticyclones An anticyclone is an area of high pressure which brings settled weather. In an anticyclone (HIGH), air is sinking to the ground which means clouds do not form. When air descends, it warms, which causes the relative humidity to lower. As a result, anticyclones produce clear beautiful skies with almost no clouds and rain. Generally boring weather - clear, calm Linger for a while, but can be nice Trap air near surface (sinking motion) Blob-like air masses Air mass stays long can take on characteristics of land High pressure systems can be identified from a synoptic chart: widely spaced isobars no fronts/clouds isobars showing pressure increasing outwards from the centre and above 1008mb High pressure characteristics Isobars are spread far apart bringing gentle winds. This is caused by a very gradual change in air pressure. Because of the gentle winds these systems can remain in place for several days. Wind - winds blow clockwise in high pressure and wind blows along the isobars; wind blows gently when isobars are widely spaced. Due to gentle winds these systems can remain in place for several days. Dry - there are no fronts in an anticyclone so there is no rain. Temperature - in summer skies are clear with little cloud and temperatures are high, while in winter, skies are also clear with little cloud, but temperatures are cold and there is a likelihood of frost and fog. Low pressure systems Cyclones/Depressions A cyclone (LOW) is simply an area of low pressure around which the winds flow counter clockwise in the Northern Hemisphere and clockwise in the Southern Hemisphere. Cyclones form and grow near the front. Cyclones (lows) are cloudy, wet, stormy A cyclone produces cloudy and rainy weather because air is moving in and rising. Rising air produces clouds from adiabatic cooling and air reaching the dew point. Low pressure systems can be identified from a synoptic chart due to: cold fronts warm fronts possible occluded fronts tightly packed isobars isobars showing pressure decreasing towards the centre from about 1004mb Warm front In a low pressure system the warm front is the first to pass over. This occurs when warm air meets cold air and the warm air rises above it. Warm fronts bring steady, continuous rain. Depression characteristics Wind - winds blow anticlockwise in a depression and along the isobars; where isobars are close together, wind is strongest. Wet - where warm air meets cold air, the warm air is pushed upwards, it cools, condenses and clouds form. Temperature - in general, the warm sector behind the warm front brings warmer temperatures and the cold sector behind the cold front brings cooler temperatures. Test Your Understanding (a) Fig.5.1 shows a sketch of isobar patterns. Fig.5.1 (i) What is an isobar? ……………………………………………………………………………………………………… ……………………………………………………………………………………………………[1] (ii) Name the regions represented by letters X and Y. x………………………………….. Y……..…………………………… [2] (i) Use an arrow at Z on Fig. 5.1 to indicate the direction of the wind at Z. The isobar pattern if for Botswana. [1] (ii) Explain the significance of region Z and how this would affect the wind speed. ………………………………………………………………………………………………… ………………………………………………………………………………………………… ………..…………………………………………………………………….………………..[2] 3. Fig. 3.1 shows gas trapped in a cylinder by a piston. Fig. 3.1 The piston has a cross-sectional area of 0.0050 m2. It moves upwards through a distance of 0.074 m, compressing the gas. During this compression, the average pressure of the gas is 4.6 × 10⁵ Pa. (a) Calculate (i) the average force exerted on the piston by the gas during compression, force……………………[2] (ii) the work done on the gas during compression. work done …………………… [2] 4. Fig. 4.1 shows a diver working below the surface of a lake. The density of the water in the lake is 1000 kg / m3, the atmospheric pressure at the surface is 1.0 × 10⁵ Pa and the gravitational field strength is 10 N / kg. Fig. 4.1 The diver inflates a balloon with air at a depth of 15 m and attaches the balloon to a tray of objects. (a) Calculate (i) the pressure due to 15 m of water, pressure ……………………… [2] (ii) the total pressure at 15 m below the surface of the lake. total pressure ……………………. [1] (b) The air in the balloon occupies a volume of 0.048 m3 at the pressure calculated in (a)(ii). The diver releases the tray and the balloon, and they begin to rise. The temperature of the air in the balloon does not change. (i) Calculate the volume occupied by the air in the balloon at atmospheric pressure. volume ………………. [2] (ii) The pressure of the air inside the balloon is less at the surface than at a depth of 15 m. Explain, in terms of the air molecules inside the balloon, why the pressure is less. …………………………………………………………………………………………………………… ……………………………………………………………………………………………………….[1] (c) State one difference between the arrangement of the molecules of water in the lake and the molecules of air in the balloon. …………………………………………………………………………………………………………… ……………………………………………………………………………………………………….[1]


