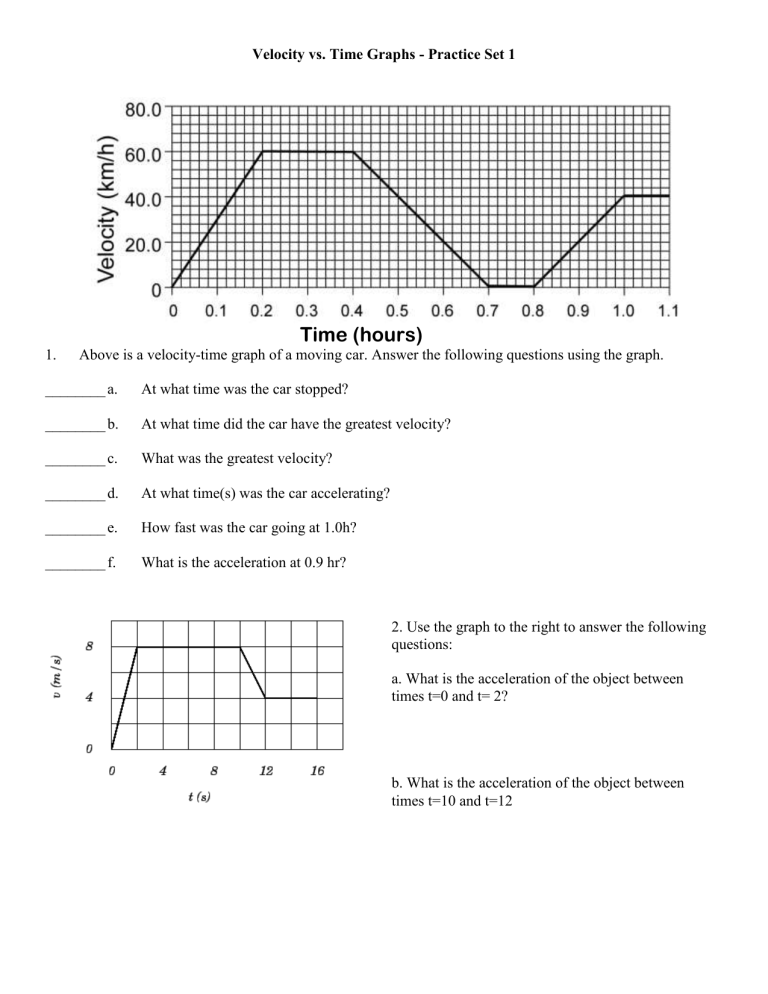
Velocity vs. Time Graphs - Practice Set 1 Time (hours) 1. Above is a velocity-time graph of a moving car. Answer the following questions using the graph. ________ a. At what time was the car stopped? ________ b. At what time did the car have the greatest velocity? ________ c. What was the greatest velocity? ________ d. At what time(s) was the car accelerating? ________ e. How fast was the car going at 1.0h? ________ f. What is the acceleration at 0.9 hr? 2. Use the graph to the right to answer the following questions: a. What is the acceleration of the object between times t=0 and t= 2? b. What is the acceleration of the object between times t=10 and t=12 5. A car accelerates from rest and reaches a velocity of 6 m/s after 2 seconds. It remains at this velocity for 1 second and then accelerates again for 3 seconds to a final velocity of 10 m/s. At this point it breaks at a stop, taking 3 seconds to do so. (a) – Graph the velocity vs. time journey on the graph below

