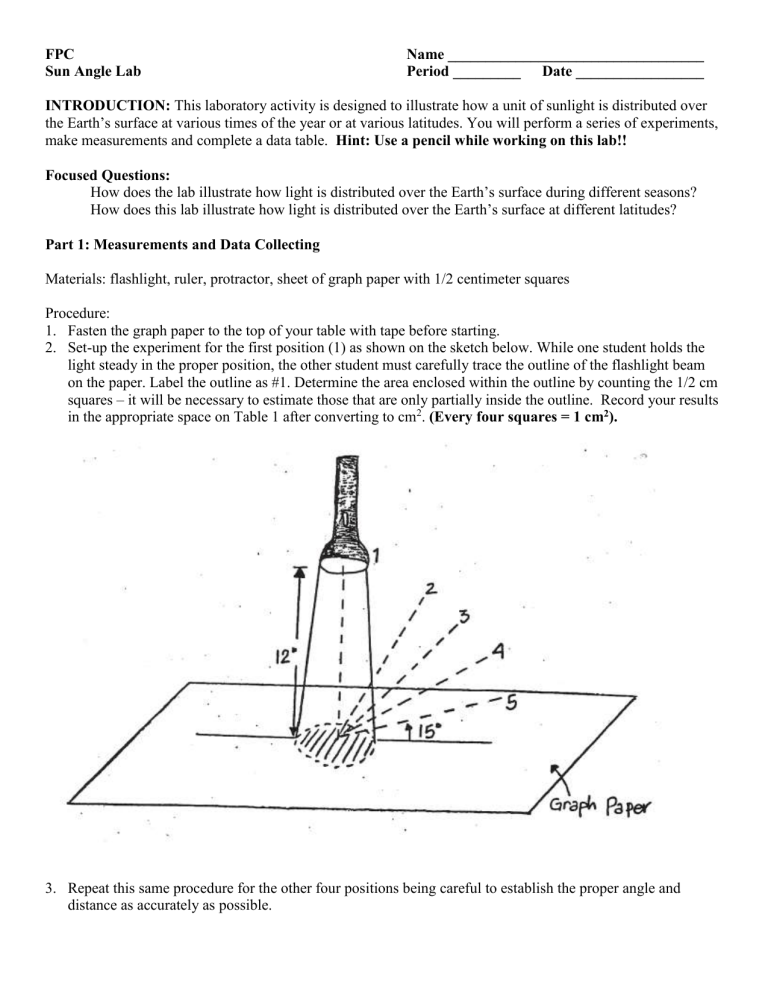
FPC Sun Angle Lab Name __________________________________ Period _________ Date _________________ INTRODUCTION: This laboratory activity is designed to illustrate how a unit of sunlight is distributed over the Earth’s surface at various times of the year or at various latitudes. You will perform a series of experiments, make measurements and complete a data table. Hint: Use a pencil while working on this lab!! Focused Questions: How does the lab illustrate how light is distributed over the Earth’s surface during different seasons? How does this lab illustrate how light is distributed over the Earth’s surface at different latitudes? Part 1: Measurements and Data Collecting Materials: flashlight, ruler, protractor, sheet of graph paper with 1/2 centimeter squares Procedure: 1. Fasten the graph paper to the top of your table with tape before starting. 2. Set-up the experiment for the first position (1) as shown on the sketch below. While one student holds the light steady in the proper position, the other student must carefully trace the outline of the flashlight beam on the paper. Label the outline as #1. Determine the area enclosed within the outline by counting the 1/2 cm squares – it will be necessary to estimate those that are only partially inside the outline. Record your results in the appropriate space on Table 1 after converting to cm2. (Every four squares = 1 cm2). 3. Repeat this same procedure for the other four positions being careful to establish the proper angle and distance as accurately as possible. Table 1: Inclination Angle and Area of Light Beam Data Position Angle Area Change* 2 (cm ) (cm2 ) () 1 90 2 60 3 45 4 30 5 15 Percent Change# (%) - Energy/Area@ (units/cm2 ) * Area of position being measured – area of position 1. # Percent Change = (area of position being measured) (area of position 1) x 100 @ Let the amount of energy in the light beam = 100 units and calculate the Energy/Area as shown below: Energy/Area = (100 units) (area of position being measured) Part 2 : Data Transformation 4. Using the data collected and half a piece of graph paper, plot the Angle of Inclination vs. the Area. 5. On the second piece of graph paper plot the Angle of Inclination vs. the Energy/Area for each measurement. Part 3: Conclusions 6. Write a conclusion for this lab. Remember to address the original focused questions and use data to support your conclusions. Include how this lab set-up modeled sunlight on the Earth at different latitudes and during different seasons. Part 4: Evaluation 7. There are a number of changes that could be made to improve the accuracy of the experiments you carried out. List at least three weakness or errors in the data collection, how it impacted the results, and ideas you would suggest to improve the experimental.
