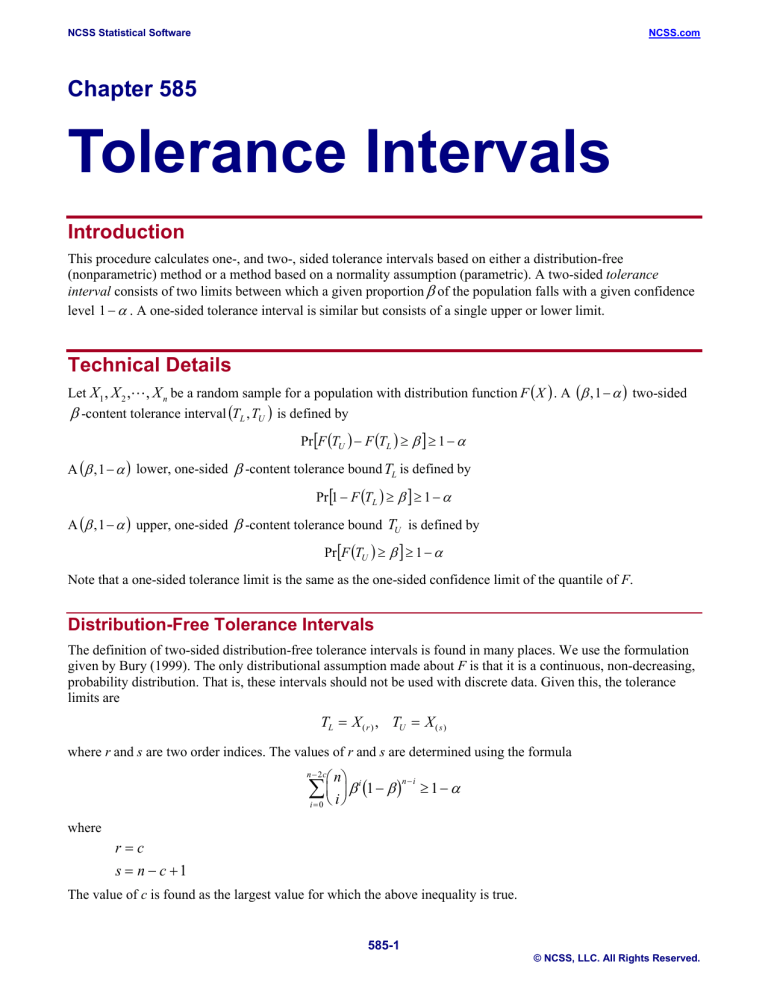
NCSS Statistical Software NCSS.com Chapter 585 Tolerance Intervals Introduction This procedure calculates one-, and two-, sided tolerance intervals based on either a distribution-free (nonparametric) method or a method based on a normality assumption (parametric). A two-sided tolerance interval consists of two limits between which a given proportion β of the population falls with a given confidence level 1 − α . A one-sided tolerance interval is similar but consists of a single upper or lower limit. Technical Details Let X1 , X 2 ,, X n be a random sample for a population with distribution function F ( X ) . A (β , 1 − α ) two-sided β -content tolerance interval (TL , TU ) is defined by Pr [F (TU ) − F (TL ) ≥ β ] ≥ 1 − α A (β , 1 − α ) lower, one-sided β -content tolerance bound TL is defined by Pr [1 − F (TL ) ≥ β ] ≥ 1 − α A (β , 1 − α ) upper, one-sided β -content tolerance bound TU is defined by Pr [F (TU ) ≥ β ] ≥ 1 − α Note that a one-sided tolerance limit is the same as the one-sided confidence limit of the quantile of F. Distribution-Free Tolerance Intervals The definition of two-sided distribution-free tolerance intervals is found in many places. We use the formulation given by Bury (1999). The only distributional assumption made about F is that it is a continuous, non-decreasing, probability distribution. That is, these intervals should not be used with discrete data. Given this, the tolerance limits are TL = X ( r ) , TU = X ( s ) where r and s are two order indices. The values of r and s are determined using the formula n n − 2c ∑ i β (1 − β ) i n−i ≥1− α i=0 where r=c s = n − c +1 The value of c is found as the largest value for which the above inequality is true. 585-1 © NCSS, LLC. All Rights Reserved. NCSS Statistical Software NCSS.com Tolerance Intervals A lower, one-sided tolerance bound is X ( r ) where r is the largest value for with the following inequality is true. n−r n ∑ i β (1 − β ) i n−i ≥1− α i=0 An upper, one-sided tolerance bound is X ( s ) where s is the largest value for with the following inequality is true. s −1 n ∑ i β (1 − β ) i n−i ≥1− α i=0 Normal-Distribution Tolerance Interval The limits discussed in this section are based on the assumption that F is the normal distribution. Two-Sided Limits In this case, the two-sided tolerance interval is defined by the interval TL = x − ks, TU = x + ks The construction reduces to the determination of the constant k. Howe (1969) provides the following approximation which is ‘nearly’ exact for all values of n greater than one k = uvw where u = z1+ β 1 + 2 v= 1 n n −1 χ n2−1,α w = 1+ n − 3 − χ n2−1,α 2( n + 1) 2 Note that originally, Howe (1969) used n – 2 in the above definition of w. But Guenther (1977) gives the corrected version using n – 3 shown above. One-Sided Bound A one-sided tolerance bound (‘bound’ is used instead of ‘limit’ in the one-sided case) is given by TU = x + ks Here k is selected so that ( ) Pr t n′ −1,δ = k n = 1 − α where t ′f ,δ represents a noncentral t distribution with f degrees of freedom and noncentrality δ = zβ n . 585-2 © NCSS, LLC. All Rights Reserved. NCSS Statistical Software NCSS.com Tolerance Intervals Data Structure The data are contained in a single column. Example 1 – Generating Tolerance Intervals This section presents a detailed example of how to generate tolerance intervals for the Height variable in the Height dataset. Setup To run this example, complete the following steps: 1 Open the Height example dataset • From the File menu of the NCSS Data window, select Open Example Data. • 2 Select Height and click OK. Specify the Tolerance Intervals procedure options • Find and open the Tolerance Intervals procedure using the menus or the Procedure Navigator. • The settings for this example are listed below and are stored in the Example 1 settings template. To load this template, click Open Example Template in the Help Center or File menu. Option Value Variables Tab Variables ................................................. Height Population Percentages for .................... 50 75 80 90 95 99 Tolerances Reports Tab Decimal Places Values ..................................................... 3 Means ..................................................... 3 Probabilities ............................................ 2 3 Run the procedure • Click the Run button to perform the calculations and generate the output. 585-3 © NCSS, LLC. All Rights Reserved. NCSS Statistical Software NCSS.com Tolerance Intervals Descriptive Statistics Descriptive Statistics of Height ────────────────────────────────────────────────── Count 20 Mean 62.100 Standard Deviation 8.441 Standard Error 1.887 Minimum 51.000 Maximum 79.000 Range 28.000 This report was defined and discussed in the Descriptive Statistics procedure chapter. We refer you to the Summary Section of that chapter for details. Two-Sided Tolerance Intervals Two-Sided 95% Tolerance Intervals of Height ───────────────────────────────────────── Percent of Population Between Limits 50.00 75.00 80.00 90.00 95.00 99.00 Parametric Lower Tolerance Limit 54.074 48.411 46.850 42.527 38.777 31.449 Parametric Upper Tolerance Limit 70.126 75.789 77.350 81.673 85.423 92.751 Nonparametric Lower Tolerance Limit 52.000 51.000 Nonparametric Upper Tolerance Limit 73.000 79.000 Notes: The parametric (normal-based) limits assume that the data follow the normal distribution. The nonparametric (distribution-free) limits make no special distributional assumption. This section gives the parametric and nonparametric two-sided tolerance intervals. Percent of Population Between Limits This is the percentage of population values that are contained in the tolerance interval. Parametric Lower (Upper) Tolerance Limits These are the values of the limits of a tolerance interval based on the assumption that the population is normally distributed. Nonparametric Lower (Upper) Tolerance Limits These are the values of the limits of a distribution-free tolerance interval. These intervals make no distributional assumption. Lower One-Sided Tolerance Bounds Lower One-Sided 95% Tolerance Bounds of Height ───────────────────────────────────── Percent of Population Greater Than Bound 50.00 75.00 80.00 90.00 95.00 99.00 Parametric Lower Tolerance Bound 60.264 52.254 50.524 45.842 41.875 34.285 Nonparametric Lower Tolerance Bound 56.000 52.000 51.000 This section gives the parametric and nonparametric one-sided tolerance bounds. 585-4 © NCSS, LLC. All Rights Reserved. NCSS Statistical Software NCSS.com Tolerance Intervals Percent of Population Greater Than Bound This is the percentage of population values that are above the tolerance bound. Parametric Lower Tolerance Bound This is the lower parametric (normal distribution) tolerance bound. Nonparametric Lower (Upper) Tolerance Limits This is the lower nonparametric (distribution-free) tolerance bound. Note that some values are missing because of the small sample size in this example. Upper One-Sided Tolerance Bounds Upper One-Sided 95% Tolerance Bounds of Height ───────────────────────────────────── Percent of Population Greater Than Bound 50.00 75.00 80.00 90.00 95.00 99.00 Parametric Upper Tolerance Bound 63.936 71.946 73.676 78.358 82.325 89.915 Nonparametric Upper Tolerance Bound 65.000 73.000 76.000 79.000 79.000 79.000 This section gives the parametric and nonparametric one-sided tolerance bounds. Percent of Population Less Than Bound This is the percentage of population values that are below the tolerance bound. Parametric Lower Tolerance Bound This is the upper parametric (normal distribution) tolerance bound. Nonparametric Lower (Upper) Tolerance Limits This is the upper nonparametric (distribution-free) tolerance bound. Normality Test Section Normality Test Section of Height ───────────────────────────────────────────────── Test Name Shapiro-Wilk W Anderson-Darling Kolmogorov-Smirnov D'Agostino Skewness D'Agostino Kurtosis D'Agostino Omnibus Test Value 0.937 0.443 0.148 1.037 -0.786 1.692 Prob Level 0.21 0.29 0.30 0.43 0.43 10% Critical Value 5% Critical Value 0.176 1.645 1.645 4.605 0.192 1.960 1.960 5.991 Decision (5%) Can't reject normality Can't reject normality Can't reject normality Can't reject normality Can't reject normality Can't reject normality This report was defined and discussed in the Descriptive Statistics procedure chapter. We refer you to the Normality Test Section of that chapter for details. 585-5 © NCSS, LLC. All Rights Reserved. NCSS Statistical Software NCSS.com Tolerance Intervals Plots Section Plots Section of Height ──────────────────────────────────────────────────────── The plots section displays a histogram and a probability plot to allow you to assess the accuracy of the normality assumption. 585-6 © NCSS, LLC. All Rights Reserved.
