EXPERIMENT # 7
FOURIER ANALYSIS OF PERIODIC SIGNALS USING
TRIGONOMETRIC FOURIER SERIES
OBJECTIVE
Decomposition of a periodic signal into its Trigonometric Fourier series coefficients
Plotting of magnitude and phase spectra using trigonometric coefficients
TRIGONOMETRIC FOURIER SERIES
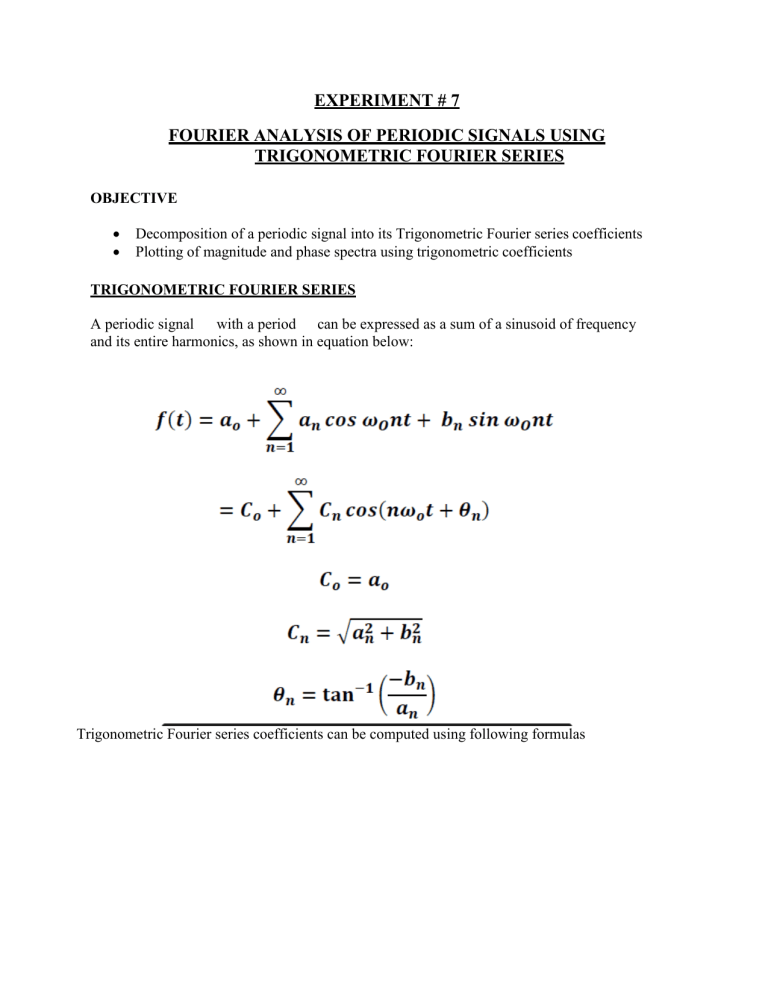
A periodic signal
with a period can be expressed as a sum of a sinusoid of frequency
and its entire harmonics, as shown in equation below:
Trigonometric Fourier series coefficients can be computed using following formulas
Exercise 7.1:
Find the Trigonometric Fourier series coefficients and plot the magnitude and phase spectra for the periodic
signals shown in MATLAB
Fourier series coefficients for the periodic signal shown above are:
The code for plotting the magnitude and phase spectra for the given co-efficients is given below using for
loop:
n=1:7;
a0=0.504;
b0=0.504*(8*0/(1+16*0^2)); % b0=0;
Cn=a0;
theta0=atan(-b0/a0);
thetan=theta0;
den=(1+16*n.^2);
N=length(den);
for i=1:N
an(i)=0.504*2/den(i);
bn(i)=0.504*8*n(i)/den(i);
cn=sqrt(an(i)^2+bn(i)^2);
Cn=[Cn cn];
theta=atan(-bn(i)/an(i));
thetan=[thetan theta];
end
n=0:7;
subplot(211),stem(n, ,'o'),grid,xlabel('n'),ylabel( ),title( )
subplot(212),stem(n,thetan,'o'),grid,xlabel('n'),ylabel('\theta_n
(rad)')
Exercise7.2: If is defined as below
Find the trigonometric Fourier series coefficients for the periodic signal given below and use them to plot
the magnitude and phase spectra in MATLAB using vector method.
Exercise 7.3:
For the periodic signal given below, mathematically compute the trigonometric Fourier series coefficients
and plotthe amplitude and phase spectra (in degrees).
POST LAB QUESTIONS:
Q.1 Write MATLAB code to plot the co-efficients an, bn computed in lab with respect to ‘n’ for
‘n’ ranging between 0 – 20. Also include the figures in your report.
