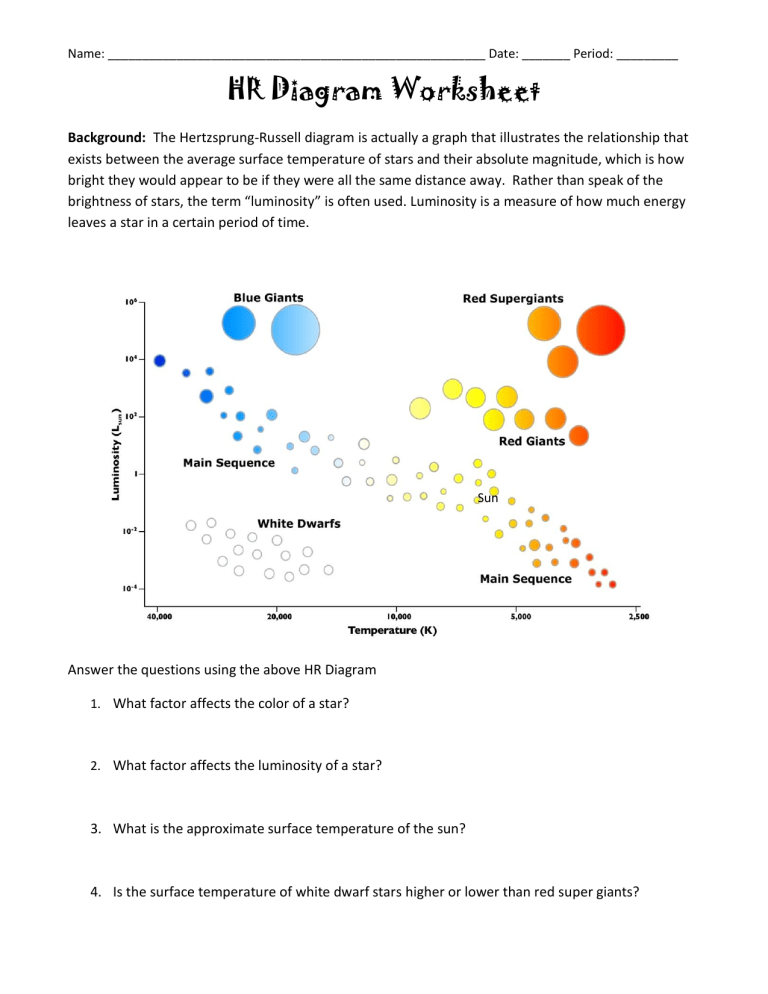
Name: _______________________________________________________ Date: _______ Period: _________ HR Diagram Worksheet Background: The Hertzsprung-Russell diagram is actually a graph that illustrates the relationship that exists between the average surface temperature of stars and their absolute magnitude, which is how bright they would appear to be if they were all the same distance away. Rather than speak of the brightness of stars, the term “luminosity” is often used. Luminosity is a measure of how much energy leaves a star in a certain period of time. Sun Answer the questions using the above HR Diagram 1. What factor affects the color of a star? 2. What factor affects the luminosity of a star? 3. What is the approximate surface temperature of the sun? 4. Is the surface temperature of white dwarf stars higher or lower than red super giants? Name: _______________________________________________________ Date: _______ Period: _________ 5. What is the color of the stars with the highest surface temperature? 6. What is the color of the stars with the lowest surface temperature? 7. List the color of the stars from hottest to coldest: 8. Most of the stars on the HR Diagram are classified as which type of star? 9. What type of star has a high temperature but a low luminosity? 10. What type of star has a high temperature and a high luminosity? 11. What type of star has a low temperature but a high luminosity? 12. What type of star has a low temperature and a low luminosity? 13. Plot the stars A - E. Once plotted determine their color and type. Letter Temperature Luminosity Color Type of Star A 6,000 k 10 -1 B 20,000 k 10 6 C 20,000 k 10 -2 D 2,500k 10 6 E 4000 k 10 2
