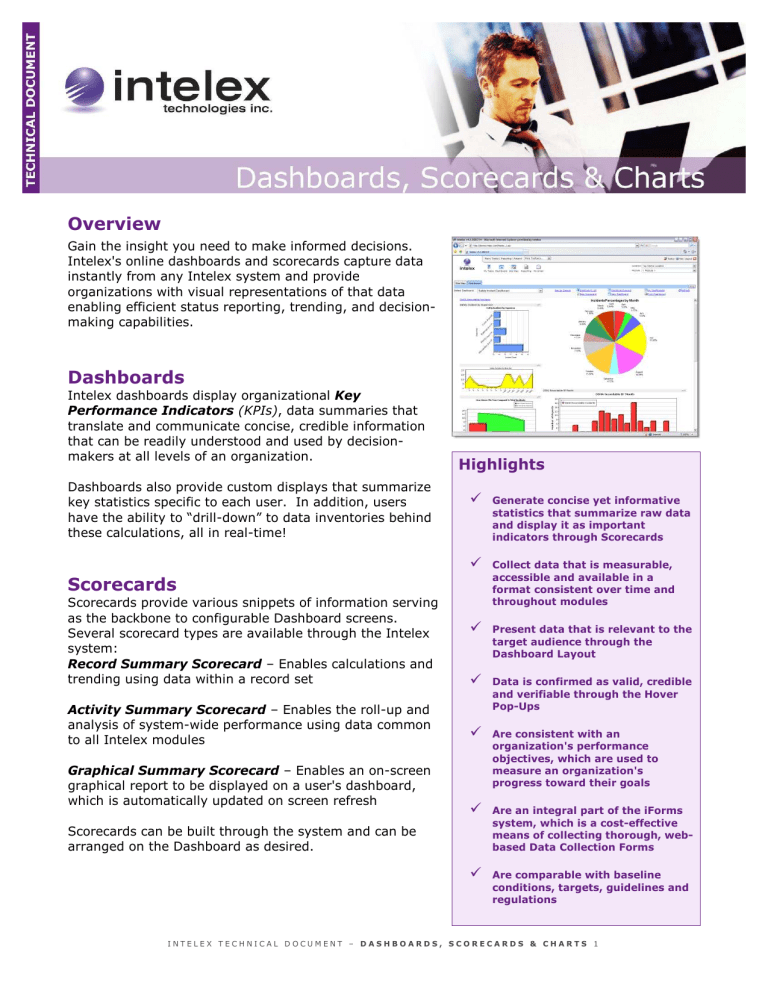
Overview Gain the insight you need to make informed decisions. Intelex's online dashboards and scorecards capture data instantly from any Intelex system and provide organizations with visual representations of that data enabling efficient status reporting, trending, and decisionmaking capabilities. Dashboards Intelex dashboards display organizational Key Performance Indicators (KPIs), data summaries that translate and communicate concise, credible information that can be readily understood and used by decisionmakers at all levels of an organization. Dashboards also provide custom displays that summarize key statistics specific to each user. In addition, users have the ability to “drill-down” to data inventories behind these calculations, all in real-time! Highlights Generate concise yet informative statistics that summarize raw data and display it as important indicators through Scorecards Collect data that is measurable, accessible and available in a format consistent over time and throughout modules Present data that is relevant to the target audience through the Dashboard Layout Data is confirmed as valid, credible and verifiable through the Hover Pop-Ups Are consistent with an organization's performance objectives, which are used to measure an organization's progress toward their goals Are an integral part of the iForms system, which is a cost-effective means of collecting thorough, webbased Data Collection Forms Are comparable with baseline conditions, targets, guidelines and regulations Scorecards Scorecards provide various snippets of information serving as the backbone to configurable Dashboard screens. Several scorecard types are available through the Intelex system: Record Summary Scorecard – Enables calculations and trending using data within a record set Activity Summary Scorecard – Enables the roll-up and analysis of system-wide performance using data common to all Intelex modules Graphical Summary Scorecard – Enables an on-screen graphical report to be displayed on a user's dashboard, which is automatically updated on screen refresh Scorecards can be built through the system and can be arranged on the Dashboard as desired. INTELEX TECHNICAL DOCUMENT – DASHBOARDS, SCORECARDS & CHARTS 1 Dashboards & Key Performance Indicators When users seek their Key Performance Data, they are blind to its source. With the Intelex system, the focus is not whether or not data comes from a configurable iForm, incidents module, or custom-built module. Rather, it showcases a combination of all data on a Dashboard, as needed, in an effort to display a more accurate and comprehensive view of an organization's performance. KPIs can be calculated and viewed in many different ways. To provide end-users with all of the KPIs that are important to them, Intelex provides a dynamic approach to screen configuration. Organizations can build an unlimited number of Scorecards for use on the Dashboard, and each Scorecard can display a wide range of indicators using data from throughout the Intelex System. Goals of the Intelex Dashboards and Scorecards To generate real-time performance metrics with an approach that allows users to configure and create their own To enable 'cross module' analysis of data and results To provide grouped metrics and analytical data that shows results rather than raw data To surpass managing of what is being done to managing how well things are being done To allow clear and concise performance measurement Dashboard Interactivity & Drill-Down Capability A Dashboard not only shows Key Performance Indicators, but also links the KPIs to source data. When a user clicks on a scorecard, they will be linked to the data used in creating that scorecard. The specific way information is presented to users depends on the type of scorecard used. Dashboard Examples Dashboards have many applications and can be used to summarize organizational initiatives in: environmental management, quality management, health and safety management, training management, and document control, just to name a few. Please view the sample dashboards on the following page and the scorecards list (right) for an idea of the type of KPIs that can be generated for use in your organization. Sample Scorecards Environmental Incidents & Corrective Actions by Month Safety Incidents Reported by Month Total Greenhouse Gas by Location Quality Nonconformances Reported by Month (This Year vs. Last Year) Scheduled Audits by Month Create Your Own Scorecard INTELEX TECHNICAL DOCUMENT – DASHBOARDS, SCORECARDS & CHARTS 2 Visit www.intelex.com/dashboards for more dashboard and scorecard samples or contact your Intelex representative today at 416-599-6009 for a FREE online demonstration. INTELEX TECHNICAL DOCUMENT – DASHBOARDS, SCORECARDS & CHARTS 3
