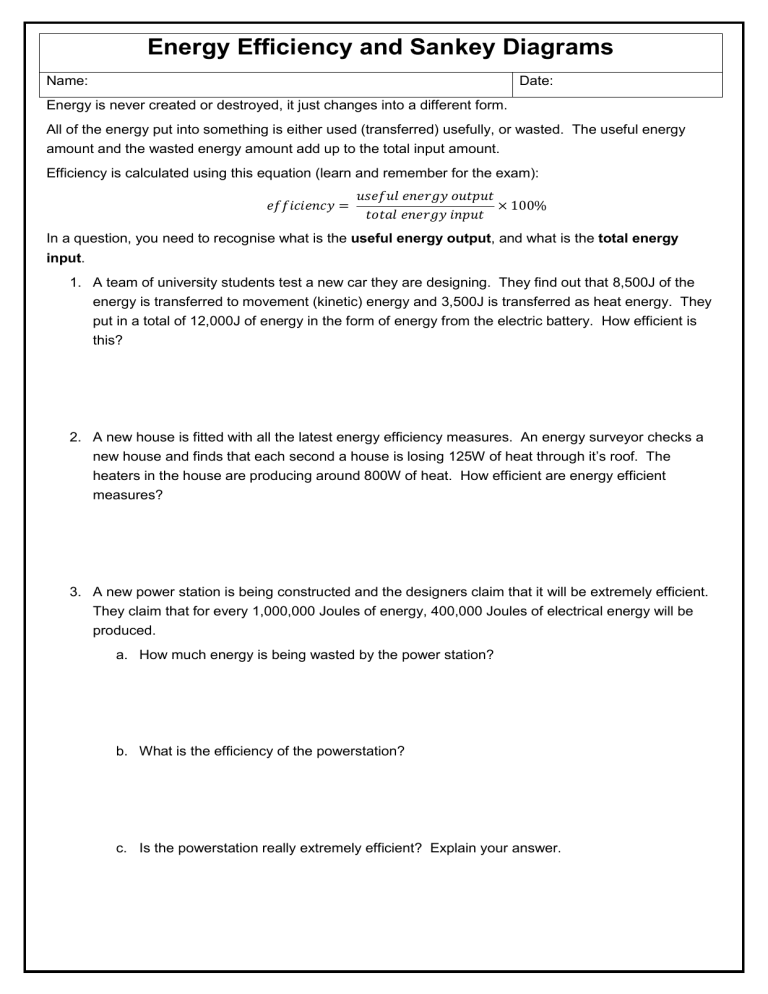
Energy Efficiency and Sankey Diagrams Name: Date: Energy is never created or destroyed, it just changes into a different form. All of the energy put into something is either used (transferred) usefully, or wasted. The useful energy amount and the wasted energy amount add up to the total input amount. Efficiency is calculated using this equation (learn and remember for the exam): 𝑒𝑓𝑓𝑖𝑐𝑖𝑒𝑛𝑐𝑦 = 𝑢𝑠𝑒𝑓𝑢𝑙 𝑒𝑛𝑒𝑟𝑔𝑦 𝑜𝑢𝑡𝑝𝑢𝑡 × 100% 𝑡𝑜𝑡𝑎𝑙 𝑒𝑛𝑒𝑟𝑔𝑦 𝑖𝑛𝑝𝑢𝑡 In a question, you need to recognise what is the useful energy output, and what is the total energy input. 1. A team of university students test a new car they are designing. They find out that 8,500J of the energy is transferred to movement (kinetic) energy and 3,500J is transferred as heat energy. They put in a total of 12,000J of energy in the form of energy from the electric battery. How efficient is this? 2. A new house is fitted with all the latest energy efficiency measures. An energy surveyor checks a new house and finds that each second a house is losing 125W of heat through it’s roof. The heaters in the house are producing around 800W of heat. How efficient are energy efficient measures? 3. A new power station is being constructed and the designers claim that it will be extremely efficient. They claim that for every 1,000,000 Joules of energy, 400,000 Joules of electrical energy will be produced. a. How much energy is being wasted by the power station? b. What is the efficiency of the powerstation? c. Is the powerstation really extremely efficient? Explain your answer. A Sankey diagram shows you how well a machine uses energy. In other words, it tells you if it uses it efficiently (without much waste) or inefficiently (with a lot of waste). The thickness of the arrows shows how much energy is involved. (The length of the arrows does not matter in a Sankey Diagram, but the width should be proportional to the amount of energy being transferred.) Useful energy transfers are shown going left to right. Wasteful energy transfers are shown going upwards or downwards. Energy into machine (100 %) Useful Energy out of machine Wasted Energy (50 %) (50 %) Draw a Sankey diagram for the following example: 4. In one second, a lightbulb uses 25J of electricity. It produces 10J of light, and the rest is wasted as heat. 5. In one second, an energy efficient light bulb produces the same about of light as the previous bulb, but only uses 12J of energy. Draw a Sankey diagram for this below. Answers 1. 8,500 / 12,000 = 0.708 (70.8%) 2. 800-125 = 675W; 675 / 800 = 0.844 (84.4%) 3. a) 1,000,000 – 400,000 = 600,000J b) 400,000 / 1,000,000 = 0.4 (40%) c) Yes : because some other powerstations waste considerably more, so in comparison to these it is efficient. No: because 60% of the energy is wasted, most likely as heat. This could be used to heat local homes / businesses / schools etc 4. 5.
