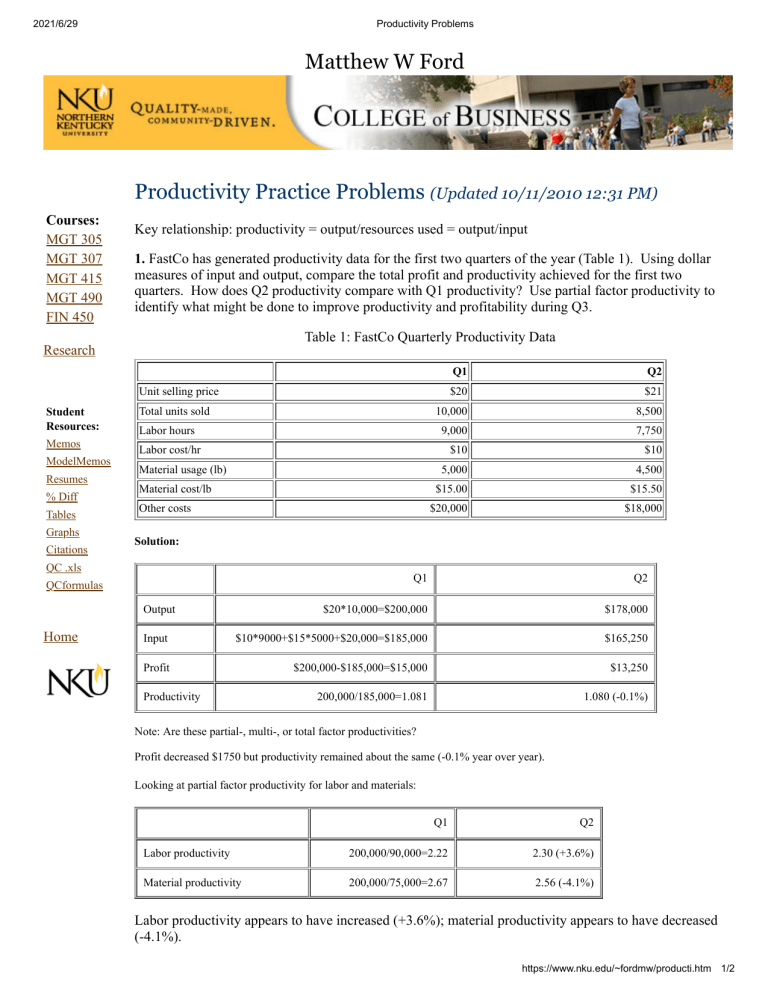
2021/6/29 Productivity Problems Matthew W Ford Productivity Practice Problems (Updated 10/11/2010 12:31 PM) Courses: MGT 305 MGT 307 MGT 415 MGT 490 FIN 450 Key relationship: productivity = output/resources used = output/input 1. FastCo has generated productivity data for the first two quarters of the year (Table 1). Using dollar measures of input and output, compare the total profit and productivity achieved for the first two quarters. How does Q2 productivity compare with Q1 productivity? Use partial factor productivity to identify what might be done to improve productivity and profitability during Q3. Table 1: FastCo Quarterly Productivity Data Research Q1 Q2 $20 $21 10,000 8,500 9,000 7,750 $10 $10 5,000 4,500 $15.00 $15.50 $20,000 $18,000 Unit selling price Student Resources: Memos ModelMemos Resumes % Diff Tables Graphs Citations Total units sold Labor hours Labor cost/hr Material usage (lb) Material cost/lb Other costs Solution: QC .xls Q1 Q2 $20*10,000=$200,000 $178,000 Input $10*9000+$15*5000+$20,000=$185,000 $165,250 Profit $200,000-$185,000=$15,000 $13,250 200,000/185,000=1.081 1.080 (-0.1%) QCformulas Output Home Productivity Note: Are these partial-, multi-, or total factor productivities? Profit decreased $1750 but productivity remained about the same (-0.1% year over year). Looking at partial factor productivity for labor and materials: Q1 Q2 Labor productivity 200,000/90,000=2.22 2.30 (+3.6%) Material productivity 200,000/75,000=2.67 2.56 (-4.1%) Labor productivity appears to have increased (+3.6%); material productivity appears to have decreased (-4.1%). https://www.nku.edu/~fordmw/producti.htm 1/2 2021/6/29 Productivity Problems 2. XYZ Manufacturing uses two measures of productivity: a) total sales/total inputs, b) total sales/total labor inputs. Given data for the last three years (Table 2), calculate the productivity ratios. How would you interpret the results. Table 2: XYZ Productivity Data (in millions of dollars) Y1 Y2 Y3 110 129 124 Materials 62 73 71 Labor 28 33 28 8 12 10 Sales Overhead Solution: Y1 Y2 Y3 Total sales/total inputs 1.12 1.09 (-2.7%) 1.13 (+3.7%) Total sales/total labor input 3.93 3.91 (-0.5%) 4.42 (+13.0%) Total factor productivity and partial factor productivity with respect to labor, after decreasing in Y2, appears to have increased in Y3. Note: Which of the above is total factor productivity? Why? 3. A hamburger factory produces 50,000 burgers each week. The equipment costs $5,000 and will remain productive for three years. The annual labor cost is $8,000. a) What is the productivity as measured in units of output per dollar of input over a 3 year period? b) Management has the option of $10,000 equipment, with an operating life of five years. It would reduce labor costs to $4,000 per year. Should management purchase this equipment (using productivity arguments alone)? Solution: a) In this case, define productivity = (total burgers produced)/($labor+$equipment)=(50,000*52*3)/(8000*3+5000) = 269 burgers/$input b) for new machine project: productivity=(50,000*52*5)/(4000*5+10,000) =433 burgers/$input This is a good project from a productivity perspective. Although the proposed equipment is expensive, 5 year life and lower labor costs make new machine attractive. NOTE: These problems are adapted from Evans, J.R. (1997). Production/Operations Management, 5th ed. Minneapolis/St. Paul: West. Site maintained 1999-2016 by Matthew W. Ford. https://www.nku.edu/~fordmw/producti.htm 2/2


