International Journal of Trend in Scientific Research and Development (IJTSRD)
Volume 5 Issue 3, March-April 2021 Available Online: www.ijtsrd.com e-ISSN: 2456 – 6470
Analysis and Simulation of Solar PV Connected with Grid
Accomplished with Boost Converter and PWM Based Inverter
Abhishek Verma, Dr. Anup Mishra, Brahma Nand Thakur
EEE Department, Bhilai Institute of Technology, Durg, Chhattisgarh, India
How to cite this paper: Abhishek Verma |
Dr. Anup Mishra | Brahma Nand Thakur
"Analysis and Simulation of Solar PV
Connected with Grid Accomplished with
Boost Converter and PWM Based
Inverter" Published
in
International
Journal of Trend in
Scientific Research
and
Development
(ijtsrd), ISSN: 24566470, Volume-5 |
IJTSRD40056
Issue-3, April 2021,
pp.992-995,
URL:
www.ijtsrd.com/papers/ijtsrd40056.pdf
ABSTRACT
This paper deals with a solar PV array connected with grid system. This
system consists of PV cells with 30 KW system, Boost converter, three phase
inverter with suitable control system and three phase load. This paper gives
analysis of each components of the system. The output voltage from the solar
PV cells are variable according to radiation intensity and temperature so in
order to connect with grid the output voltage should be fixed and converted to
AC voltage and this job will be done by an inverter. A very effective control
system has been developed for the inverter based on pulse width modulation.
This paper presents an intensive performance and dynamic behavior of a grid
related PV energy conversion system. The PV system is developed and
simulated with the help of MATLAB/ Simulink software environment.
KEYWORDS: Pulse Width Modulation (PWM), Insulated gate bipolar transistor
(IGBT), THD (Total harmonic distortion), STATCOM (static synchronous
compensator), SVC (static VAR compensator)
Copyright © 2021 by author (s) and
International Journal of Trend in Scientific
Research and Development Journal. This
is an Open Access article distributed
under the terms of
the
Creative
Commons Attribution
License
(CC
BY
4.0)
(http://creativecommons.org/licenses/by/4.0)
INTRODUCTION
The world constraint of fossil fuels reserves and additionally
the ever growing environmental pollutants have driven
powerfully throughout ultimate many years the occasion of
renewable strength sources (RES). The necessity of getting
obtainable property power systems for substitution bit
through bit trendy ones demands the improvement of
systems of power provide based on smooth and renewable
resources. At present, solar electric photovoltaic (PV) era is
ahead redoubled significance as a RES application because of
distinctive blessings like simplicity of allocation, high
responsibility, absence of gasoline value, low preservation
and absence of noise and wear thanks to the absence of
moving factors or practical’s. Moreover, the alternative
energy characterizes a clean, pollutants-loose and
inexhaustible power supply. Additionally to those elements
are the declining value and expenses of solar PV modules,
associate degree increasing efficiency of sun cells, producing
generation enhancements and economies of scale [1].
to generate a good quality power with lesser incremental cost
as much as possible and with lesser carbon emission. In that
case we use renewable sources to generate power with good
quality. So we should adopt the most convenient and
cheapest way for generation transmission and distribution. In
order to get an optimum power generation hybrid electricity
is used so that increase in price may get compensated by the
use of renewable assets.
Many government schemes are running for the incentives in
installation of renewable sources worldwide that will also be
considered in planning of incremental cost of the project as
well as payback period from the savings of electricity bills
revenue.
PROPOSED MODEL
The warming of global surface is increasing 0.6 degree
Celsius per century. This warming caused by huge release of
carbon dioxide and carbon monoxide. This causes acid rain,
depletion of ozone layer and radioactive emission these
effects can be minimized by searching some effective
solution, this solution also include energy conservation with
improved energy efficiency.
Now As per the financial terms electricity generation using
renewable sources have higher price as compared to the nonrenewable resources. But now a days the major challenge is
@ IJTSRD
|
Unique Paper ID – IJTSRD40056
|
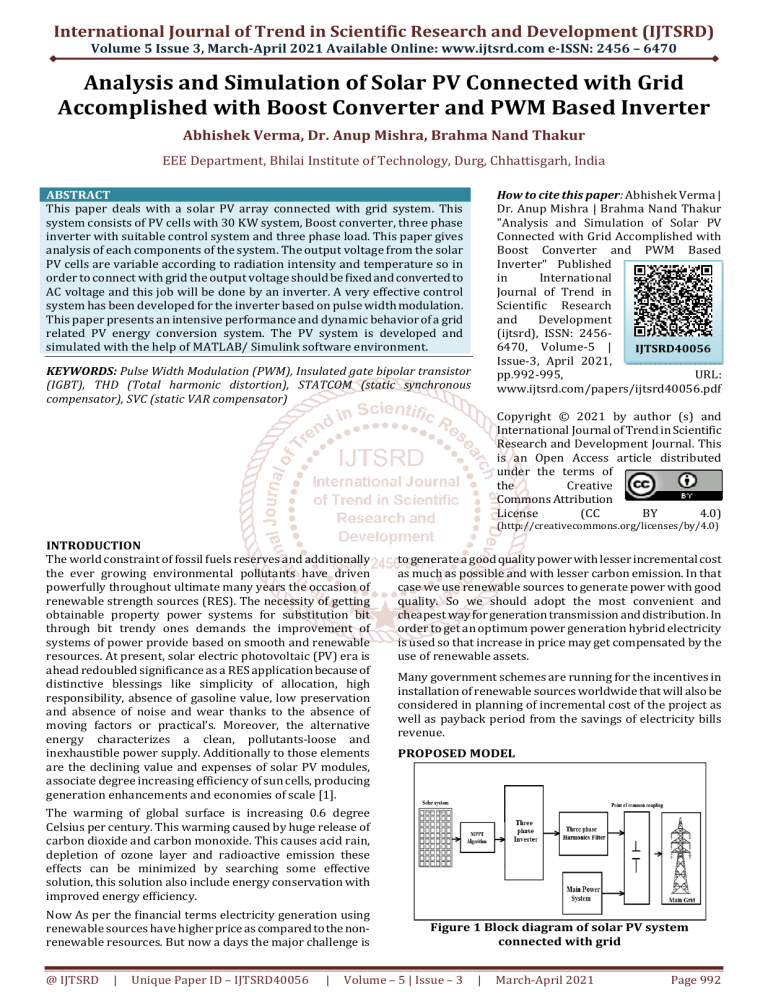
Figure 1 Block diagram of solar PV system
connected with grid
Volume – 5 | Issue – 3
|
March-April 2021
Page 992
International Journal of Trend in Scientific Research and Development (IJTSRD) @ www.ijtsrd.com eISSN: 2456-6470
Figure 1 shows the solar PV system connected with grid
but as we know that solar radiations are not in the same
intensity throughout the day due to clouds or shadows or
some other disturbances and due to this reason solar
energy is unreliable. The PV array output is connected
with DC-DC boost converter to rise the output voltage up
to a desired level.
MODELLING OF PV ARRAY
Total 30 array system is connected to achieve 30 KW of
power with suitable series and parallel combination. In a
single module 30 cells are connected in series to get 22 v
open circuit voltage. The mathematical model of PV cell is
represented by a current source with a diode connected in
parallel as shown in figure 2. The intrinsic series
resistance whose value is very small. The equivalent shunt
resistance whose value is very high, applying Kirchhoff’s
law to the node where Iph, diode, Rp and Rs meet. [2]
Circuit Diagram of boost converter
Figure 4 Circuit diagram of boost converter
TheFig.4showsastepuporPWMboostconverter. This consists
of adc input voltage source VIN; boost inductor L controlled
switch T, diodeD, filter capacitor C and load resistance RL.
When the switch T is in on state, the current in the boost
inductor increases linearly and the diode D is off at that time,
when the switch T is turned off, the energy stored in the
inductor is released through the diode to the output RC
circuit. The transfer function for the boost converter is [2]
…………………………. (1)
PV ARRAY CHARACTERISTIC CURVE
The current to voltage characteristics of solar PV is
nonlinear. Therefore it is difficult to determine the
maximum power point. The below figure gives I-V and P-V
curve for solar irradiation
Figure 2 PV Cell Model
Figure 5 I-V and P-V curve characteristics.
Figure3 Simulink model of PV array
BOOST CONVERTER
The PV system generates DC voltage in all the variable
conditions of solar radiations. The generated voltage is
low and variable and it must be somewhat high and
constant at the input of inverter. So we need a boost
converter device to boost the voltage as well it try to
maintain constant boosted voltage.
INVERTER CONTROL
Conversion of AC source through Dc sources is achieved by
a device known as inverter. Starting from a small
switching device to large electricity applications like bulk
power transmission inverters are extensively used. Pulse
width modulation is a powerful technique for controlling
analog circuits with a processors digital output. [3] [4]
The proposed model uses the technique where the
variable load is connected to the output of inverter so
whenever there is variation in voltage it can be normalized
by control methodology process. The voltage at the output
of inverter is fed back to the controller where it is
compared with the reference bus voltage. The error is then
controlled and normalized through PI controller. The
proper tuning of proportional and integrator gain is done
by initial assumptions.
The PI controller output is in unit tolerance band and to
make it alternate proportional to the bus voltage PLL
block is used. The pulses generated from PWM generator
block is of variable width.
Figure 6 shows the equivalent circuit of voltage source
converter PWM VSI used here is a three phase VSI with six
Figure4 Subsystem Of boost converter
@ IJTSRD
|
Unique Paper ID – IJTSRD40056
|
Volume – 5 | Issue – 3
|
March-April 2021
Page 993
International Journal of Trend in Scientific Research and Development (IJTSRD) @ www.ijtsrd.com eISSN: 2456-6470
switches. In this figure three phase converters has six
semiconductors displayed in three legs a, b and c. Only one
switch on the same leg can be conducting at the same time
each switch (s1, s2, s3, s4, s5 and s6) in the inverter branch is
composed of semiconductor devices connected with anti
parallel diode. The semiconductor device is a controllable
device and diode is for protection. [5]
This proposed model describes the PV array of 30 KW which
is further connected to DC-DC boost converter to boost the
output voltage from array and this DC voltage is converted to
AC voltage with the help of inverter and for the constant
voltage magnitude and frequency a control system has been
developed so that a constant voltage and frequency will be
available to the load side or grid.
Various measurement system has been placed at various
stages to measure all the parameters for the research and
analysis at various stages of the system.
RESULTS
Figure 6 Six switch composition of converter
Figure 8 Three phase voltage at output
Figure 7 Simulink model of controller
This control system of inverter consists of three main
subsystems. The first subsystem is voltage measurement
block. This block measured three phase voltage of load side
as it varies as voltage magnitude varies. This voltage is then
converted to phase voltage, line voltage and rms value of
phase voltage. The next subsystem is controller. The VLL
gives the reference line voltage which has to be maintained
across the grid. This VLL is then multiplied with the rms value
of phase voltage and the obtained value is compared with the
unit value. The produced signal is given to the PI controller.
The values of gain in PI controller is set to normalize the
voltage value, the signal generated from PI controller is a DC
signal. So in order to make a perfect sinusoidal signal a PLL
block is added to match the bus sinusoidal voltage and
frequency. The output of this controller then passes through
the PWM generator. This PWM generator compares the
sinusoidal signal with the triangular wave and then generates
the firing pulses by PWM modulation technique.
Figure 9 Three phase current at output
Figure 10 Inverter line to line voltage
PROPOSED MODEL
Figure 11 Duty and output voltage of boost
converter
Figure 8 Proposed model
@ IJTSRD
|
Unique Paper ID – IJTSRD40056
|
Volume – 5 | Issue – 3
|
March-April 2021
Page 994
International Journal of Trend in Scientific Research and Development (IJTSRD) @ www.ijtsrd.com eISSN: 2456-6470
[2]
Sankalp Verma1, Hemant Verma2, Md. Khwaja
Mohiddin3K. Elissa, “MODELING & ANALYSIS OF
STANDALONE PHOTOVOLTAICSYSTEM,” IJRET:
International Journal of Research in Engineering
and Technology eISSN: 2319-1163 | pISSN: 23217308
[3]
M. Makhlouf, F. Messai, H. Benalla, “Modeling and
Control of a single-phase grid Connected
photovoltaic system”, Journal of Theoretical and
Applied Information Technology, Vol. 37, 31st
March 2012.
[4]
Soeren Baekhoej Kjaer, Member, IEEE, John K.
Pedersen, Senior Member, IEEE, and Frede
Blaabjerg, Fellow, IEEE, “A Review of Single-Phase
Grid-Connected Inverters for Photovoltaic
Modules”, IEEE Transactions on industry
applications, vol. 41, no. 5, September/October
2005.
[5]
Jay Verma, Yogesh Tiwari, Anup Mishra, Nirbhay
Singh “ Performance, Analysis and Simulation of
Wind Energy Conversion System Connected with
Grid,” International Journal of Recent Technology
and Engineering (IJRTE) ISSN: 2277-3878, Volume2 Issue-6, January 2014
[6]
Nema, S., Nema, R., & Agnihotri, G. (2010). “Matlab
/ simulink based study of photovoltaic cells /
modules / array and their experimental
verification.” International Journal of Energy and
Environment, Vol. 1, Issue 3, pp. 487-500.
[7]
Rahim, O. A., Orabi, M., & Ahmed, M. E. (2010).
“Development of High-Gain High-Efficiency GridConnected Inverter for PV Module.” 2010 2nd IEEE
International Symposium on Power Electronics for
Distributed Generation System, Egypt, pp. 368-373.
[8]
Reinaldos, L., González, R., Borrega, M., & Balda, J.
(2009, November). “Fuzzy Switching Technique
Applied to PWM Boost Converter Operating in
Mixed Conduction Mode for PV Systems.” IEEE
Transaction on Industrial Electronics, pp. 43634373.
Figure 12 FFT analysis
S.NO
1
2
3
PARAMETERS
Name of block
Specification
Parallel strings = 3
Series connected modules
PV Array
per string = 10
Short circuit current = 5.45
Open circuit voltage = 22.5
Phase to phase voltage = 400
Grid
Frequency = 50
Capacitance = 20 microfarad
Boost converter Initial capacitor voltage =
550
CONCLUSION
This paper presents a solar PV system connected with
grid in which PWM based inverter is used to produce
three phase electricity generation. The whole model is
simulated in MATLAB Simulink. Parameters taken has
been described in the above table and the results are as
shown in the above figures almost sinusoidal some more
filtration has to be done accordingly to get the smooth
output. In future we can work out on the total harmonic
distortion that may be reduced from the 42% by using
different FACTS devices like SVC and STATCOM.
References
[1] Carrasco JM, Franquelo LG, Bialasiewicz JT, Galva´n
E, Portillo- Guisado RC, Martı´n-Prats MA, et al.
Power electronic systems for the grid integration of
renewable energy sources: a survey. IEEE Trans
Ind Electron 2006; 53(4):1002e16.
@ IJTSRD
|
Unique Paper ID – IJTSRD40056
|
Volume – 5 | Issue – 3
|
March-April 2021
Page 995


