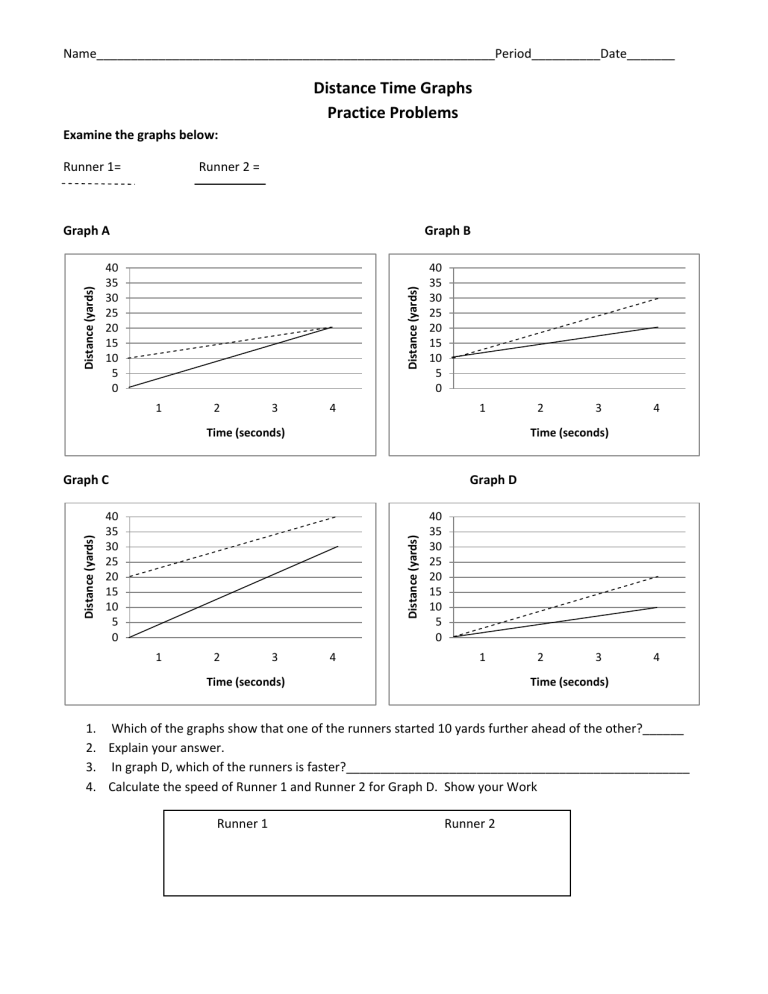
Name__________________________________________________________Period__________Date_______ Distance Time Graphs Practice Problems Examine the graphs below: Runner 1= Runner 2 = Graph B 40 35 30 25 20 15 10 5 0 Distance (yards) Distance (yards) Graph A 1 2 3 40 35 30 25 20 15 10 5 0 4 1 Time (seconds) 3 4 Time (seconds) Graph C Graph D 40 35 30 25 20 15 10 5 0 Distance (yards) Distance (yards) 2 1 2 3 4 40 35 30 25 20 15 10 5 0 1 Time (seconds) 2 3 4 Time (seconds) 1. Which of the graphs show that one of the runners started 10 yards further ahead of the other?______ 2. Explain your answer. 3. In graph D, which of the runners is faster?__________________________________________________ 4. Calculate the speed of Runner 1 and Runner 2 for Graph D. Show your Work Runner 1 Runner 2 Graph B 40 35 30 25 20 15 10 5 0 Distance (yards) Distance (yards) Graph A 1 2 3 40 35 30 25 20 15 10 5 0 4 1 Time (seconds) 4 Graph D 40 35 30 25 20 15 10 5 0 Distance (yards) Distance (yards) 3 Time (seconds) Graph C 1 2 3 4 Time (seconds) 1. 2 40 35 30 25 20 15 10 5 0 1 2 3 4 Time (seconds) In which of the graphs ( A or C ) are both runners moving at the same speed? 2. Calculate the average speed for Runner 2 in graph B. 3. What is the total distance for Runner 2 in Graph A?____________________________________________ 4. In Graph B, about how long did it take for Runner 1 to travel between 10 and 20 yards?______________ 5. Which runner traveled the farthest in Graph D?_______________________________________________ The distance –time graphs below represent the motion of a car. Match the descriptions with the graphs. Explain your answers. Descriptions: 1. The car stopped. 2. The car is traveling at constant speed. 3. The speed of the car is decreasing. 4. The car is coming back. B. Distance Distance A. Time D. Distance Distance C. Time Time Time Graph A matches description _________ because________________________________________________. Graph B matches description _________ because________________________________________________. Graph C matches description _________ because________________________________________________. Graph D matches description _________ because________________________________________________. 120 DISTANCE (meters) 100 80 60 Albert Bob 40 Charlie 20 0 2 2 4 4 6 6 8 8 10 10 12 1214 14 16 16 18 18 TIME (seconds) Look at the graph above. It shows how three runners ran a 100-meter race. 1. Which runner won the race?_________________________________________________________ 2. Explain your answer. 3. 4. Which runner stopped for a rest?______________________________________________________ Explain your answer. 5. How long was the stop?_______________________________________________________________ 6. Explain your answer. 7. How long did Bob take to complete the race?_____________________________________________ 8. Explain your answer. 9. Calculate each runner’s average speed. Show your Work! a. Albert____________________________ b. Bob______________________________ c. Charlie____________________________
