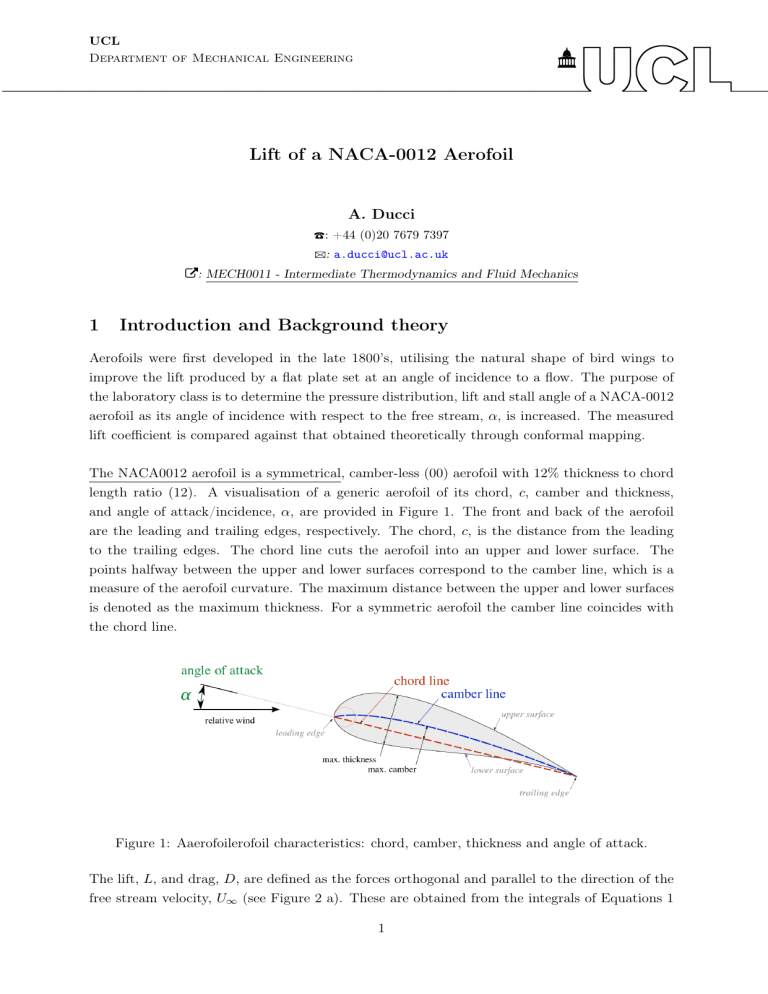
UCL Department of Mechanical Engineering Lift of a NACA-0012 Aerofoil A. Ducci T: +44 (0)20 7679 7397 B: a.ducci@ucl.ac.uk W: MECH0011 - Intermediate Thermodynamics and Fluid Mechanics 1 Introduction and Background theory Aerofoils were first developed in the late 1800’s, utilising the natural shape of bird wings to improve the lift produced by a flat plate set at an angle of incidence to a flow. The purpose of the laboratory class is to determine the pressure distribution, lift and stall angle of a NACA-0012 aerofoil as its angle of incidence with respect to the free stream, α, is increased. The measured lift coefficient is compared against that obtained theoretically through conformal mapping. The NACA0012 aerofoil is a symmetrical, camber-less (00) aerofoil with 12% thickness to chord length ratio (12). A visualisation of a generic aerofoil of its chord, c, camber and thickness, and angle of attack/incidence, α, are provided in Figure 1. The front and back of the aerofoil are the leading and trailing edges, respectively. The chord, c, is the distance from the leading to the trailing edges. The chord line cuts the aerofoil into an upper and lower surface. The points halfway between the upper and lower surfaces correspond to the camber line, which is a measure of the aerofoil curvature. The maximum distance between the upper and lower surfaces is denoted as the maximum thickness. For a symmetric aerofoil the camber line coincides with the chord line. Figure 1: Aaerofoilerofoil characteristics: chord, camber, thickness and angle of attack. The lift, L, and drag, D, are defined as the forces orthogonal and parallel to the direction of the free stream velocity, U∞ (see Figure 2 a). These are obtained from the integrals of Equations 1 1 and 2 of the pressure, p, and shear stresses, ~τ , acting on the aerofoil surface, see Figure 2 (b), where subscripts “l” and “u” denote the upper and lower surfaces, respectively. Z Z ~τ · ĵ dS (1) p (n̂ · ĵ) dS + L=− ZS ZS ~τ · î dS (2) p (n̂ · î) dS + D=− S S In Equations 1 and 2 the unit vector n̂ is locally normal to the aerofoil surface (see Figure 2 b), and when multiplied by î and ĵ it provides the pressure component in the x and y directions, respectively (i.e. n̂ · î = sin(θ), n̂ · ĵ = ± cos θ, depending whether the upper or lower side is considered). (a) (b) Figure 2: (a) Visualisation of lift and drag forces with respect to the free stream velocity direction; (b) Pressure and shear stresses acting on the upper and lower surfaces of the aerofoil. The lift and drag coefficients, cL and cD , are defined in Equations 3 and 4: L cL = 1 2 2 ρU∞ S D cD = 1 2 2 ρU∞ S (3) (4) where S is the external surface of the wing, which is estimated by multiplying the wing chord, c, by the wing span, b (i.e. S = b × c, see inset of Figure 2 b). The lift and drag of the aerofoil 2 investigated in this lab are those corresponding to an infinite wing (2D problem), and it is worth defining the lift and drag coefficients c0L and c0D per unit of wingspan as follows: L c0L = 1 2 2 ρU∞ c D c0D = 1 2 2 ρU∞ c (5) (6) To determine the region of suction and compression around the aerofoil, the pressure coefficient, cp , is defined in Equation 7, which is a measure of the local pressure difference with respect to the free stream pressure, p∞ . A suction region is associated to cp < 0, while a compression region is related to cp > 0. A typical representation of cp around an aerofoil is provided in Figure 3, where local suction is denoted with vectors locally orthogonal to the aerofoil surface and pointing away from it. On the contrary a compression region is visualised with vectors pointing towards the surface aerofoil. p − p∞ (7) cp = 1 2 2 ρU∞ Figure 3: Visualisation of the pressure coefficient, cp , around an aerofoil. In typical aerodynamic situations the pressure p is two orders of magnitude greater than τ , which mainly contributes to the friction drag. Therefore the lift and the corresponding coefficient, cL , are mainly determined from the first term of Equation 1. Based on these considerations the pressure and lift coefficients are related according to Equation 8. Z 1 c 0 cp (n̂ · ĵ) dx (8) cL = − c 0 Section 2 provides details on the experimental apparatus and instructions on the experimental procedure, while information on the report structure and data analysis is given in Section 3. 3 2 Wind tunnel laboratory - Experimental procedure The emphasis of the laboratory is on data acquisition, data analysis, and data interpretation enabling you to compare experimental findings with theoretical results. Read through the instructions before you start. The chord and wing span of the NACA-0012 aerofoil used in the laboratory are c = 150 mm and b = 300 mm, respectively. Pressure readings are obtained on the upper and lower profiles of the mid wing cross-section at the non-dimensional distances, x/c, from the leading edge reported in Table 1. Upper profile, x/c 0.005 0.025 0.076 0.127 0.253 0.413 0.538 0.676 0.813 0.914 Lower profile, x/c 0.01 0.051 0.102 0.152 0.274 0.396 0.518 0.64 0.762 0.864 Table 1: Positions along the chord length of the pressure tapping points on the upper and lower aerofoil profiles. An example of the pressure measured by the multitube manometer on the upper and lower surfaces is shown in Figure 4. Odd positions of the multitube manometer refer to the upper surface, even positions refer to the lower surface. From position 21 onwards the column of water measures the atmospheric pressure in the room. Figure 4: Image of the multitube used to measure the pressure on the upper and lower surfaces of the airfoil. 4 The free stream total, ptot , and static, p∞ , pressures, are obtained from the pitot tube and wall static pressure tapping shown in Figure 5. The pressure values that you read on the manometer are with respect to the atmospheric pressure in the room (see Figure 6). The free stream dynamic 2 , is obtained by applying Bernoulli (Equation 9): pressure, 12 ρU∞ 1 2 ptot = p∞ + ρU∞ 2 (9) Figure 5: Sketch of the wind tunnel and of the pitot tube used to estimate ptot and p∞ . Air density and dynamic viscosity are ρ = 1.23 kg/m3 and µ = 1.983 × 10− 5 Pa s, respectively. 5 Figure 6: Image of the manometers used to estimate ptot and p∞ . Prior to the lab - Watch the lab introduction video, read the assignment and the wind tunnel manual. A PGTA will be present throughout the laboratory. You can ask any question you might have. Have Microsoft Teams installed in your computer. At the start of the Teams session the PGTA will check your UCL ID to confirm attendance of the laboratory. After a brief introduction the PGTA will grant you control of the desktop computer through Teams. 2.1 Registration and data acquisition During the laboratory you will navigate through three different Labview panels which interface the desktop computer to the wind tunnel: “registration/instruction” panel, “Experiment part 1” panel and “Experiment part 2” panel. 1. Instruction panel you will enter your emails and make a folder named after your group number. 2. Experiment part 1 The wind tunnel will be started by the PGTA. Read and save an image of the free stream 6 total, ptot and static, p∞ , pressures, respectively. This will allow you to determine the free stream velocity, U∞ (See Figure 5). 3. Experiment part 2 Set values of α to -9, -7.2, -5.4, -3.6, -1.8, 0, 1.8, 3.6, 5.4, 7.2, 9, 10.8, 12.6, 14.4, 16.2, 18 degrees and save an image of the pressure distribution on the airfoil surfaces from the multitube manometer. 4. Remember to write down the units of each data point (either Pa, kPa or mmH2 O). Full information on the experimental apparatus is provided in the Wind Tunnel manual uploaded on Moodle in the Laboratory section (W: Wind Tunnel Manual). 7 3 Group dynamics and Report The report submission deadline is 11th of January at 13:00. This lab is worth 15% of the final mark. Each Group should submit a single report in Moodle (W: Submission). Late submissions will be subject to mark penalties according to the academic manual (W: Late Submission, see Section 3.12). Each group will be allocated a Moodle forum where group members will all agree on how to divide the work load and set intermediate deadlines for each member to be on track. If a member fails to deliver by the agreed deadline this has to be flagged up in the Moodle forum. In this case the group will decide the best strategy to complete the report by the final deadline (either by giving another chance to the student, or for the others to take over the outstanding task). Everything has to be documented and agreed in the forum. The report is subject to peer marking therefore you are expected to include in the first page of the report the table below showing the contributions of each group member. If you believe that the percentage contribution was not equally spread across the group members you will provide reasons and evidence in the bottom section of Table 2. Evidence should only refer to load repartition and deadlines agreed by all members in the Moodle group forum. Group # Name Contribution % Signature - - - Reasons: Evidence: refer back to the group forum Table 2: Percentage contribution of group members. The report should be structured according to the following subsections and include the different items provided. Introduction to Lift and Drag 14 marks • Describe what lift and drag are. • Describe the difference between form and friction drags, and how their contribution differ in streamlined and bluff bodies. • How do you determine the lift coefficient of a finite wing using the coefficient of an infinite one? explain why this is necessary and mention measures to improve the efficiency of a wing. 8 Part 1 - Experimental Data Processing 43 marks • Describe the experimental apparatus, the experimental procedure and sources of error (you can use photo/sketch). Why do you measure negative pressures? • Determine the free stream velocity, U∞ , and the Reynolds number, Re. • For each angle of attack determine the pressure coefficient, cp , of the upper and lower surface, and provide these values in a table (Use a measurement of the static pressure in each tapping with respect to the atmospheric value, i.e. water height difference between the tapping and the water level in position 21). • Plot the variation along the chord of cp at α = 0◦ , 4◦ and 14◦ and provide discussion. • Determine the lift coefficient, c0L , using Equation 8. Assume that the local normal to the surface wall is always aligned with the y direction (i.e. n̂ · ĵ is either +1 or -1 depending if you are considering the top or bottom surface). For more information see the methodology illustrated in the Wind Tunnel Manual (page 13). • Plot the lift coefficient, c0L , against α and compare it to that found by NACA (W: page 12, NACA Technical Note 2074). For better comparison you should put the measured and NACA profiles in the same graph. • Discuss the point above describing what is an aerofoil stall. Part 2 - Conformal Mapping 43 marks The stream function of the flow around a cylinder of radius, R, is given in Equation 10: Γ R2 log(r) ψ = U∞ sin(θ) r 1 − 2 + r 2π (10) where the cylindrical coordinate system (r, θ) of Figure 7 is used (i.e. x = r cos(θ) and y = r sin(θ)). To apply the stream function theory the flow is assumed to be irrotational and the fluid inviscid. The lift of the cylinder is proportional to the circulation Γ according to Equation 11: L = ρU∞ Γ (11) 9 Figure 7: Cylindrical coordinate system. Conformal mapping allows to transform points and lines in the (x, y) plane to points and lines in the (ξ, ζ) plane. This is shown in Figure 8, where the cylinder cross-section in the (x, y) plane has been transformed into a aerofoil shape in the (ξ, ζ). Figure 8: Conformal mapping of a circle into an aerofoil profile. The transformation of Figure 8 is named after Joukowsky, and it is specific to reproduce aerofoil shapes. The Joukowsky transformation, G(z), is provided in Equation 12: λ2 zp λ = (R − x2c + yc2 ) G(z) = z + (12) (13) where xc , yc and λ are transformation parameters, while z and G(z) are two complex numbers identifying points in the (x, y) and (ξ, ζ) planes, respectively (i.e. z = x − xc + (y − yc ) × i and G(z) = ξ + ζ × i). By varying xc , yc and λ elliptic shapes, cambered and camberless aerofoils can be obtained. As part of the coursework download the excel file Model-lab-students.xls. Click on the Conformal mapping and NACA tab and the first column on the left hand side will show current values of “Lambda value” (i.e. λ), “Off Center Value x” (i.e. xc ) and “Off Center Value y (i.e. yc ). As you change these parameters the orange circle in the right plot will assume different shapes. 10 The plot also visualises the profile of a NACA-0012 aerofoil. In the following analysis use R=1 and U∞ = 1. • Use the model in the Excel file to assess how the shape of the cylinder changes when you vary the parameters, xc , yc and λ. • Determine the values of xc and yc such that the aerofoil created through conformal mapping is closer to the NACA-0012 of this lab (use Equation 13 to determine λ). Discuss how you optimised the parameters. Estimate the chord, c, and maximum thickness, tmax , of the transformed aerofoil. • Plot the stream line around the cylinder in the (x, y) plane for α = 0 and ψ = ± ......(Value to be assigned by teaching assistants); you might want to explicit Equation 10 in terms of sin θ and vary r (i.e. sin(θ) = f (r)). • Use the Joukowsky transformation, G(z), of Equation 12 to obtain the corresponding streamlines around the aerofoil in the (ξ, ζ) plane (remember that ξ and ζ are the real and imaginary parts of G(z)). • Use the Kutta condition to determine the circulation Γ as a function of the angle of incidence α for a cylinder. Discuss what the Kutta condition imposes. • Determine the lift, L, from Equation 11 and plot the lift coefficient, c0L , of the aerofoil as a function of the angle of incidence (use Equation 5 and the aerofoil chord found above). • Compare the plot of the lift coefficient, c0L , with that obtained from experimental analysis (put the two plots in the same graph). Discuss on the validity of conformal mapping over the range of angles investigated. 11
