Materials : devices with Internet access
How Many Pairs of Shoes Do You Own?
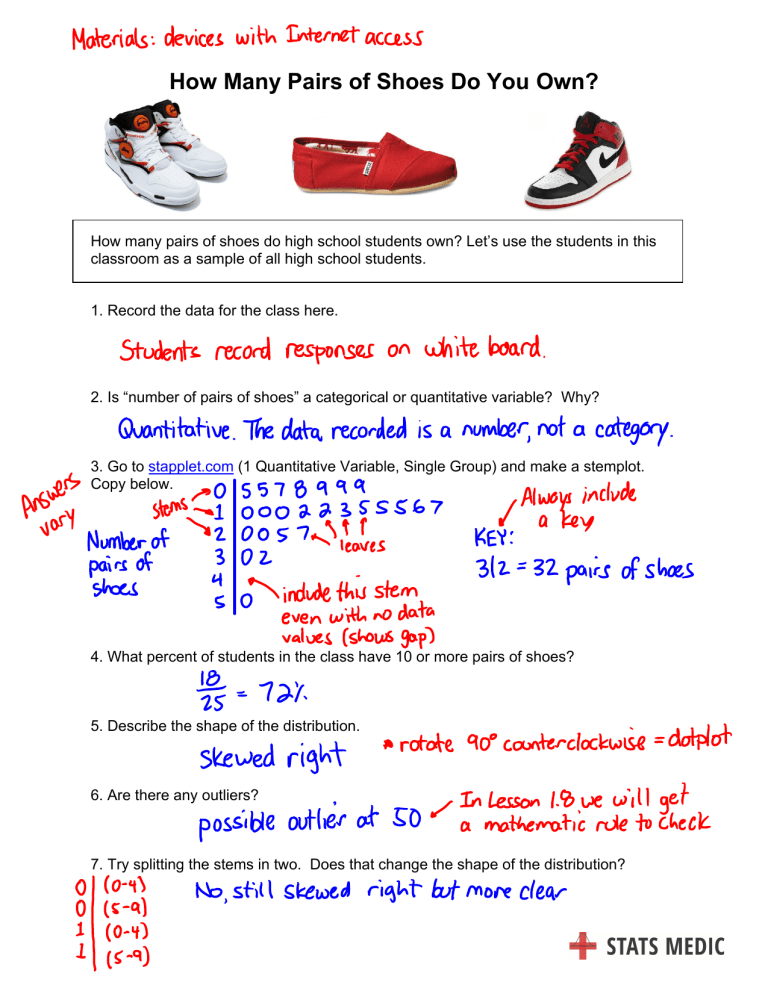
How many pairs of shoes do high school students own? Let’s use the students in this
classroom as a sample of all high school students.
1. Record the data for the class here.
students record responses
on
white board
.
2. Is “number of pairs of shoes” a categorical or quantitative variable? Why?
Quantitative The data recorded
.
Answers
van
is
a
number, not
a
category
.
3. Go to stapplet.com (1 Quantitative Variable, Single Group) and make a stemplot.
Copy below.
÷¥§{
stems I.
number .
pairs of
shoes
I }?:&:&:
"'
y
*
Always include
a
:
312=32
9 include this stem
key
pairs
of shoes
with no data
values (shows gap)
4. What percent of students in the class have 10 or more pairs of shoes?
18
Ts
=
even
72%
5. Describe the shape of the distribution.
Skewed
6. Are there any outliers?
possible
right
*
rotate 90
outlier at 501
counterclockwise
In Lesson 1.8
a
we
mathematic
will
¥118
,
( O 4)
-
15-9)
right but more clear
dotplot
get
role to check
7. Try splitting the stems in two. Does that change the shape of the distribution?
No still skewed
=
Lesson 1.4 – Displaying Quantitative Data: Stemplots
QuickNotes
LT# I
akingstemplot
Leaf: last number
before
stem : other numbers
the leaf
4*43 Describe and compare distributions
① shape (skewed left skewed right symmetric)
middle value
② center typical
,
:
,
or
.
how spread out
.us#i: i :i i:io:icom.g
*÷÷÷÷÷:÷÷÷÷÷÷÷÷:*
Vari
:
Lesson App 1.4 Who wears seat belts?
Each year, the National Highway Traffic Safety Administration
(NHTSA) conducts an observational study of seat belt use in
all 50 states. Trained observers are placed at randomly
selected locations along roadways in each state, who then
record data on seat belt use by people in passing vehicles. The
stemplot shows the percent of observed people who were
wearing seat belts in each state during the 2018 NHTSA study.
1. Why did we split stems when making this stemplot? We split stems to get a better picture of
the distribution of the percent of observed people who were wearing seatbelts. Without splitting
stems, the stemplot would only have had 3 stems corresponding to the first digits 7, 8, and 9.
2. In how many states was seat belt use observed to be at least 95% in 2018? There are
6 states for which seat belt use was observed to be at least 95%.
Some states enforce a seat belt violation as a primary
offense, while other states only enforce a seat belt
violation as a secondary offense. The back-to-back
stemplot shows the percent of observed people who
were wearing seat belts in primary enforcement
versus secondary enforcement states during the 2018
NHTSA study.
3. Compare the distributions of seat belt use in
primary and secondary enforcement states.
The shape of the distribution of seat belt use is single-peaked and slightly skewed left for primary
enforcement states and is single-peaked and fairly symmetric for secondary enforcement states. There are
two possible outliers among the primary enforcement states (78% and 80%) and among the secondary
enforcement states (76% and 79%). However, the median of the percent of observed people who were
wearing seat belts in primary enforcement states was greater (median = 91%) than that of secondary
enforcement states (median = 86%). In primary enforcement states, seat belt usage varied more (78% to
98%) than in secondary enforcement states (76% to 92%).


