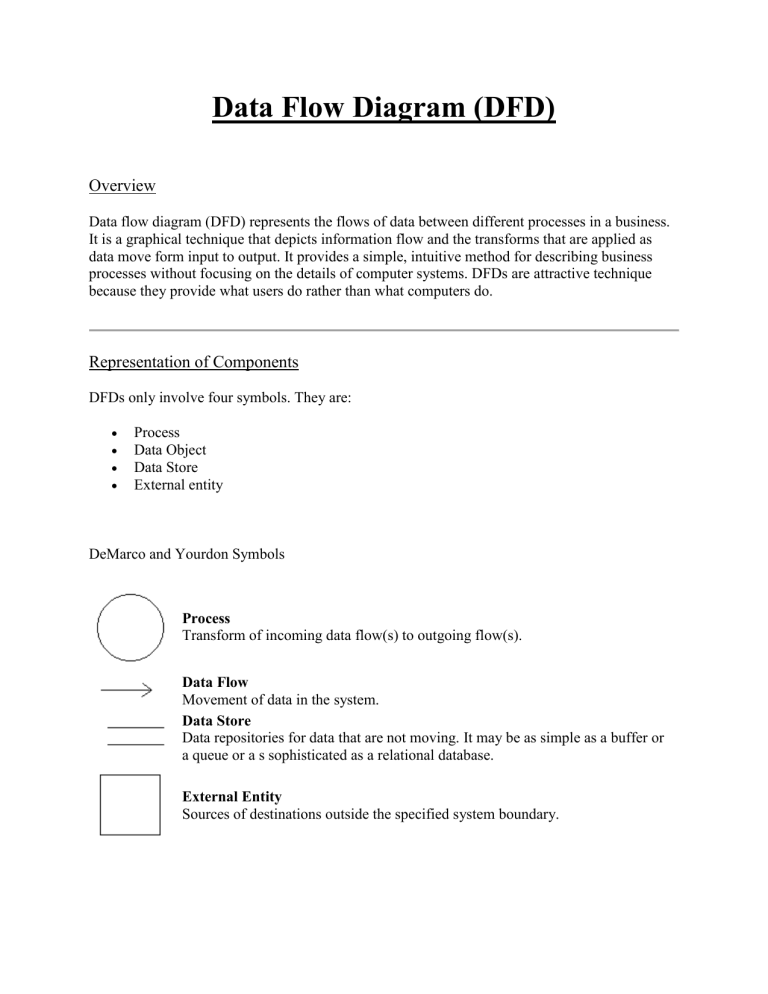
Data Flow Diagram (DFD) Overview Data flow diagram (DFD) represents the flows of data between different processes in a business. It is a graphical technique that depicts information flow and the transforms that are applied as data move form input to output. It provides a simple, intuitive method for describing business processes without focusing on the details of computer systems. DFDs are attractive technique because they provide what users do rather than what computers do. Representation of Components DFDs only involve four symbols. They are: Process Data Object Data Store External entity DeMarco and Yourdon Symbols Process Transform of incoming data flow(s) to outgoing flow(s). Data Flow Movement of data in the system. Data Store Data repositories for data that are not moving. It may be as simple as a buffer or a queue or a s sophisticated as a relational database. External Entity Sources of destinations outside the specified system boundary. Gane and Sarson Symbols of the same elements: Relationship and Rules Relationship The DFD may be used for any level of data abstraction. DFD can be partitioned into levels. Each level has more information flow and data functional details than the previous level. Highest level is Context Diagram. Some important points are: 1 bubble (process) represents the entire system. Data arrows show input and output. Data Stores NOT shown. They are within the system. Diagram above is an example of Context Level DFD Next Level is Level 0 DFD. Some important points are: Level 0 DFD must balance with the context diagram it describes. Input going into a process are different from outputs leaving the process. Data stores are first shown at this level. Diagram above show an example of Level 1 DFD Next level is Level 1 DFD. Some important points are: Level 1 DFD must balance with the Level 0 it describes. Input going into a process are different from outputs leaving the process. Continue to show data stores. Diagram above show an example of Level 1 DFD A DFD may look similar to a flow chart. However, there is a significant difference with the data flow diagram. The arrows in DFDs show that there is a flow of data between the two components and not that the component is sending the data that must be executed in the following component. A component in DFD may not continue execution when sending data and during execution of the component receiving the data. The component sending data can send multiple sets of data along several connections. In fact, a DFD node can be a component that never ends. Rules In DFDs, all arrows must be labeled. The information flow continuity, that is all the input and the output to each refinement, must maintain the same in order to be able to produce a consistent system. The Food Ordering System Example Context DFD A context diagram is a data flow diagram that only shows the top level, otherwise known as Level 0. At this level, there is only one visible process node that represents the functions of a complete system in regards to how it interacts with external entities. Some of the benefits of a Context Diagram are: 1. Shows the overview of the boundaries of a system 2. No technical knowledge is required to understand with the simple notation 3. Simple to draw, amend and elaborate as its limited notation The figure below shows a context Data Flow Diagram that is drawn for a Food Ordering System. It contains a process (shape) that represents the system to model, in this case, the "Food Ordering System". It also shows the participants who will interact with the system, called the external entities. In this example, Supplier, Kitchen, Manager and Customer are the entities who will interact with the system. In between the process and the external entities, there are data flow (connectors) that indicate the existence of information exchange between the entities and the system. Context DFD is the entrance of a data flow model. It contains one and only one process and does not show any data store. Level 1 DFD The figure below shows the level 1 DFD, which is the decomposition (i.e. break down) of the Food Ordering System process shown in the context DFD. Read through the diagram and then we will introduce some of the key concepts based on this diagram. The Food Order System Data Flow Diagram example contains three processes, four external entities and two data stores. Based on the diagram, we know that a Customer can place an Order. The Order Food process receives the Order, forwards it to the Kitchen, store it in the Order data store, and store the updated Inventory details in the Inventory data store. The process also deliver a Bill to the Customer. Manager can receive Reports through the Generate Reports process, which takes Inventory details and Orders as input from the Inventory and Order data store respectively. Manager can also initiate the Order Inventory process by providing Inventory order. The process forwards the Inventory order to the Supplier and stores the updated Inventory details in the Inventory data store.
