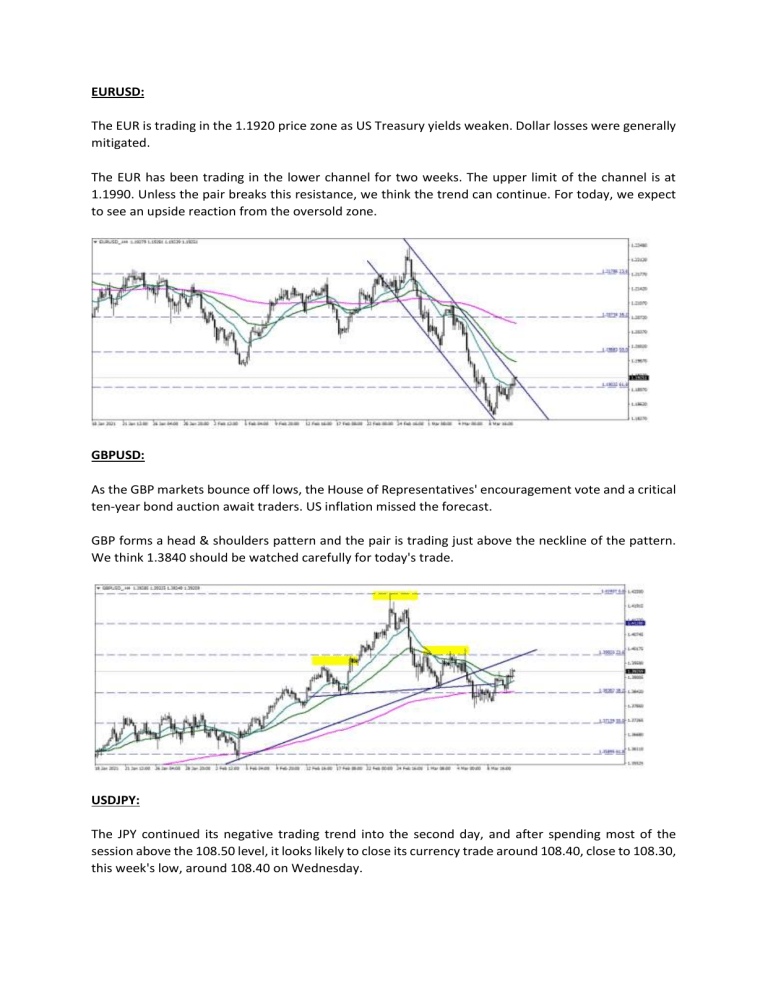
EURUSD:
The EUR is trading in the 1.1920 price zone as US Treasury yields weaken. Dollar losses were generally
mitigated.
The EUR has been trading in the lower channel for two weeks. The upper limit of the channel is at
1.1990. Unless the pair breaks this resistance, we think the trend can continue. For today, we expect
to see an upside reaction from the oversold zone.
GBPUSD:
As the GBP markets bounce off lows, the House of Representatives' encouragement vote and a critical
ten-year bond auction await traders. US inflation missed the forecast.
GBP forms a head & shoulders pattern and the pair is trading just above the neckline of the pattern.
We think 1.3840 should be watched carefully for today's trade.
USDJPY:
The JPY continued its negative trading trend into the second day, and after spending most of the
session above the 108.50 level, it looks likely to close its currency trade around 108.40, close to 108.30,
this week's low, around 108.40 on Wednesday.
The uptrend continues in the overbought territory in JPY and shows a negative divergence in the CCI.
We may see a correction during the day; however, the underlying trend is positive above 108.
GOLD:
Gold prices started flat Wednesday after rising on Tuesday with a decline in US Treasury bond yields
and a weakening dollar. While the US House of Representatives is expected to vote on the fiscal
stimulus package on Wednesday, US Treasury Secretary Janet Yellen said the fiscal stimulus package
was not large enough to cause inflation problems.
Gold creates a descending wedge pattern. The formation's resistance level is at 1718. If gold can break
this resistance, we can see an upward reaction against SMA50 (H4).
SILVER:
Precious metal prices started flat Wednesday after rising on Tuesday with a decline in US Treasury
bond yields and a weakening dollar. While the US House of Representatives is expected to vote on the
fiscal stimulus package on Wednesday, US Treasury Secretary Janet Yellen said the fiscal stimulus
package was not large enough to cause inflation problems.
Silver is at just above 26 USD band. SMAs pass through the USD 25.80 – 26.40 zone. For positive
acceleration, the motion must continue above this band. 26.90 and 28.10 USD levels can be observed
for movements over 26 USD. In possible bearish moves, the support levels are below USD 26, followed
by USD 25 and USD 23.80.
BRENT OIL:
Oil continued its decline with the dollar strengthening and mixed inventory data. According to the data
of the American Petroleum Institute (API), which is supported by the private sector, last week gasoline
stocks decreased while crude oil stocks increased.
Brent shows a negative divergence in the overbought zone and CCI. If the commodity tests below
68.70, we can see a correction in Brent.
WTI:
WTI shows a negative bias in the overbought zone and CCI. If the commodity tests under 63, we can
see a correction in WTI.
DAX 30:
European stocks were in a positive session for the third time on Wednesday as Wall Street stocks
soared after satisfying inflation data. Well-received gains from Adidas and Just Eat Takeaway lifted
these stocks.
The DAX index is below the 14600 band. Above 200 SMA converging to 13900, it is also above the 20
SMA and 50 SMA regions in 14100 – 14300. Above 14600, levels of 14800 and 14900 can be observed
in the positive movement of the index. Under 14600 technical level support will be followed for 14400
and 14200.
S&P 500:
The S&P 500 surged on Wednesday and the blue-chip Dow hit a record high after warm consumer price
data for February calmed inflation concerns and legislators gave final approval to one of the biggest
economic stimulus measures in US history.
S&P 500 index is below 3920 band. Above 200 SMA converging to 3850, it is also above the 20 SMA
and 50 SMA regions in 3860 – 3870 region. In the positive movement of the index, 3960 and 4010
levels above 3920 can be observed. Below the 3920 technical level, support for 3880 and 3830 will be
followed.
NASDAQ:
NASDAQ index is below the 12900 band. Below 200 SMA converging to 13100, it is also within the 20
SMA and 50 SMA regions in 12700 – 12800 region. In the positive movement of the index, 13100 and
13300 levels above 12900 can be observed. Below the 12900 technical level, support for 12600 and
12400 will be followed.
FTSE 100:
UK stocks retracted their previous losses to close almost flat on Wednesday after US stocks posted
early gains in line with expectations after inflation data.
The FTSE index is below the 6770 band. Above the 200 SMA converging to 6590, it is also above the 20
SMA and 50 SMA regions in the 6660 – 6690 region. In the positive movement of the index, 6930 and
7100 levels above 6770 can be seen. Below the technical level 6770, support for 6600 and 6390 will be
followed.


