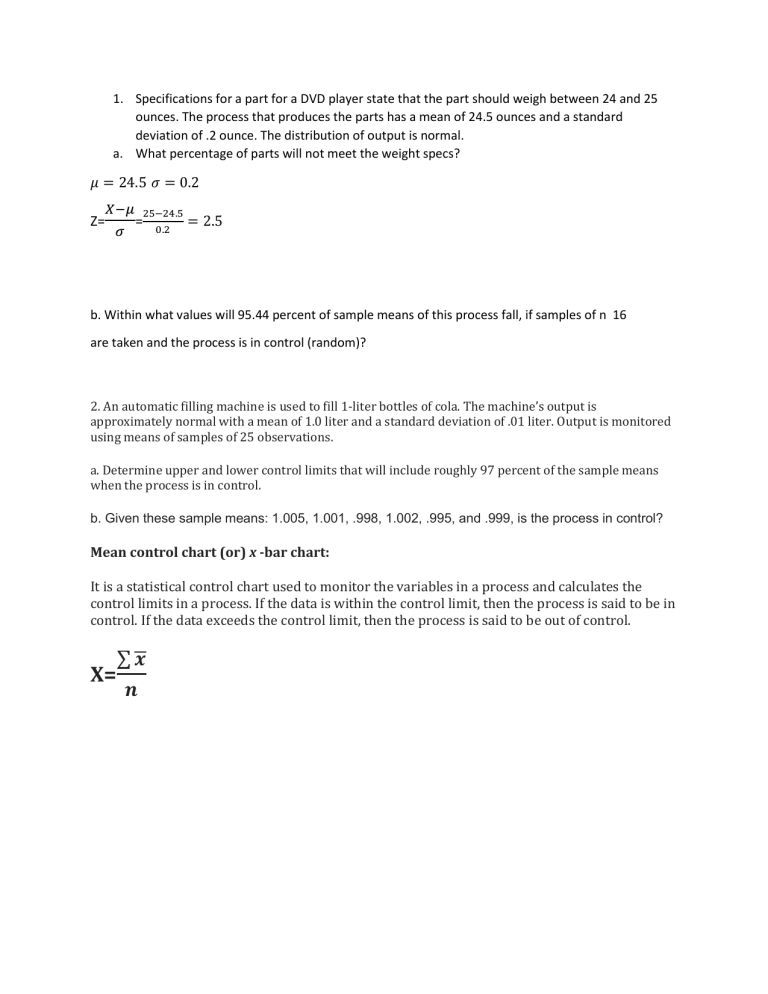
1. Specifications for a part for a DVD player state that the part should weigh between 24 and 25 ounces. The process that produces the parts has a mean of 24.5 ounces and a standard deviation of .2 ounce. The distribution of output is normal. a. What percentage of parts will not meet the weight specs? 𝜇 = 24.5 𝜎 = 0.2 Z= 𝑋−𝜇 𝜎 25−24.5 = 0.2 = 2.5 b. Within what values will 95.44 percent of sample means of this process fall, if samples of n 16 are taken and the process is in control (random)? 2. An automatic filling machine is used to fill 1-liter bottles of cola. The machine’s output is approximately normal with a mean of 1.0 liter and a standard deviation of .01 liter. Output is monitored using means of samples of 25 observations. a. Determine upper and lower control limits that will include roughly 97 percent of the sample means when the process is in control. b. Given these sample means: 1.005, 1.001, .998, 1.002, .995, and .999, is the process in control? Mean control chart (or) x -bar chart: It is a statistical control chart used to monitor the variables in a process and calculates the control limits in a process. If the data is within the control limit, then the process is said to be in control. If the data exceeds the control limit, then the process is said to be out of control. X= ∑𝒙 𝒏
