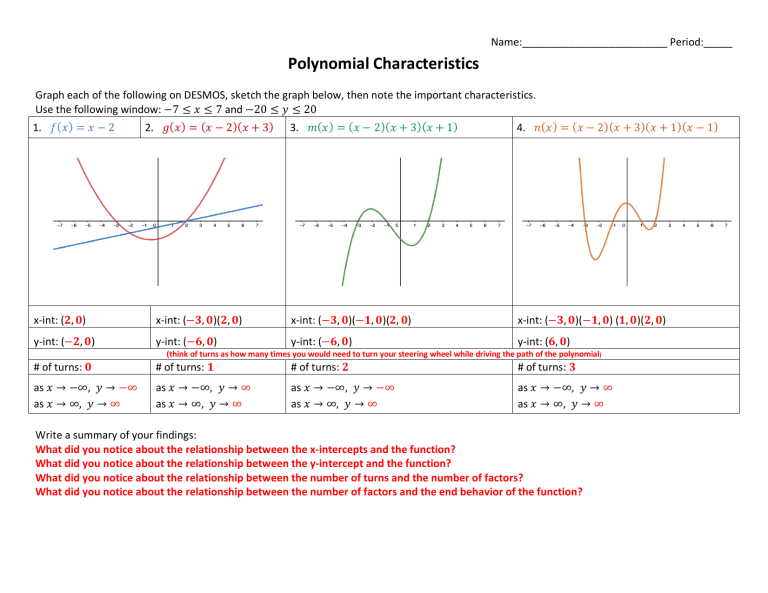
Name:_________________________ Period:_____ Polynomial Characteristics Graph each of the following on DESMOS, sketch the graph below, then note the important characteristics. Use the following window: −7 ≤ 𝑥 ≤ 7 and −20 ≤ 𝑦 ≤ 20 1. 𝑓(𝑥) = 𝑥 − 2 2. 𝑔(𝑥 ) = (𝑥 − 2)(𝑥 + 3) 3. 𝑚(𝑥 ) = (𝑥 − 2)(𝑥 + 3)(𝑥 + 1) 4. 𝑛(𝑥 ) = (𝑥 − 2)(𝑥 + 3)(𝑥 + 1)(𝑥 − 1) x-int: (𝟐, 𝟎) x-int: (−𝟑, 𝟎)(𝟐, 𝟎) x-int: (−𝟑, 𝟎)(−𝟏, 𝟎)(𝟐, 𝟎) x-int: (−𝟑, 𝟎)(−𝟏, 𝟎) (𝟏, 𝟎)(𝟐, 𝟎) y-int: (−𝟐, 𝟎) y-int: (−𝟔, 𝟎) y-int: (−𝟔, 𝟎) y-int: (𝟔, 𝟎) (think of turns as how many times you would need to turn your steering wheel while driving the path of the polynomial) # of turns: 𝟎 # of turns: 𝟏 # of turns: 𝟐 # of turns: 𝟑 as 𝑥 → −∞, 𝑦 → −∞ as 𝑥 → ∞, 𝑦 → ∞ as 𝑥 → −∞, 𝑦 → ∞ as 𝑥 → ∞, 𝑦 → ∞ as 𝑥 → −∞, 𝑦 → −∞ as 𝑥 → ∞, 𝑦 → ∞ as 𝑥 → −∞, 𝑦 → ∞ as 𝑥 → ∞, 𝑦 → ∞ Write a summary of your findings: What did you notice about the relationship between the x-intercepts and the function? What did you notice about the relationship between the y-intercept and the function? What did you notice about the relationship between the number of turns and the number of factors? What did you notice about the relationship between the number of factors and the end behavior of the function? Graph each of the following on DESMOS, then sketch each graph. Pay special attention to each intercept, then note the listed characteristics. Use the following window: −7 ≤ 𝑥 ≤ 7 and −175 ≤ 𝑦 ≤ 75 (you may want to zoom in to see the intercepts better) 5. 𝑓(𝑥) = 𝑥 − 2 6. ℎ(𝑥 ) = (𝑥 − 2)(𝑥 + 3)< 7. 𝑝(𝑥 ) = (𝑥 − 2)(𝑥 + 3)< (𝑥 + 1)> 8. 𝑞(𝑥 ) = (𝑥 − 2)(𝑥 + 3)< (𝑥 + 1)> (𝑥 − 1)< x-int: (𝟐, 𝟎) x-int: (−𝟑, 𝟎)(𝟐, 𝟎) x-int: (−𝟑, 𝟎)(−𝟏, 𝟎)(𝟐, 𝟎) x-int: (−𝟑, 𝟎)(−𝟏, 𝟎) (𝟏, 𝟎)(𝟐, 𝟎) y-int: (−𝟐, 𝟎) y-int: (−𝟏𝟖, 𝟎) y-int: (−𝟏𝟖, 𝟎) y-int: (−𝟏𝟖, 𝟎) # of turns: 𝟎 as 𝑥 → −∞, 𝑦 → −∞ as 𝑥 → ∞, 𝑦 → ∞ # of turns: 𝟐 as 𝑥 → −∞, 𝑦 → −∞ as 𝑥 → ∞, 𝑦 → ∞ # of turns: 𝟓 as 𝑥 → −∞, 𝑦 → ∞ as 𝑥 → ∞, 𝑦 → ∞ # of turns: 𝟕 as 𝑥 → −∞, 𝑦 → ∞ as 𝑥 → ∞, 𝑦 → ∞ How are these graphs different than those on #1-3? (Specifically discuss the behavior around the zeros and the end behavior) What did you notice about the relationship between the x-intercepts and the function? Specifically the exponents on the factors. What did you notice about the relationship between the number of turns and the number of factors? Remember that (𝒙 − 𝟓)𝟐 is (𝒙 − 𝟓)(𝒙 − 𝟓) so (𝒙 − 𝟓)𝟐 is actually 2 factors, not just one. What did you notice about the relationship between the number of factors and the end behavior of the function? What changes if the last factor in #8 is not squared? Graph this: 𝒔(𝒙) = (𝒙 − 𝟐)(𝒙 + 𝟑)𝟐 (𝒙 + 𝟏)𝟑 (𝒙 − 𝟏) What happens if the last factor is just 𝑥? Graph this: 𝒓(𝒙) = (𝒙 − 𝟐)(𝒙 + 𝟑)𝟐 (𝒙 + 𝟏)𝟑 𝒙
