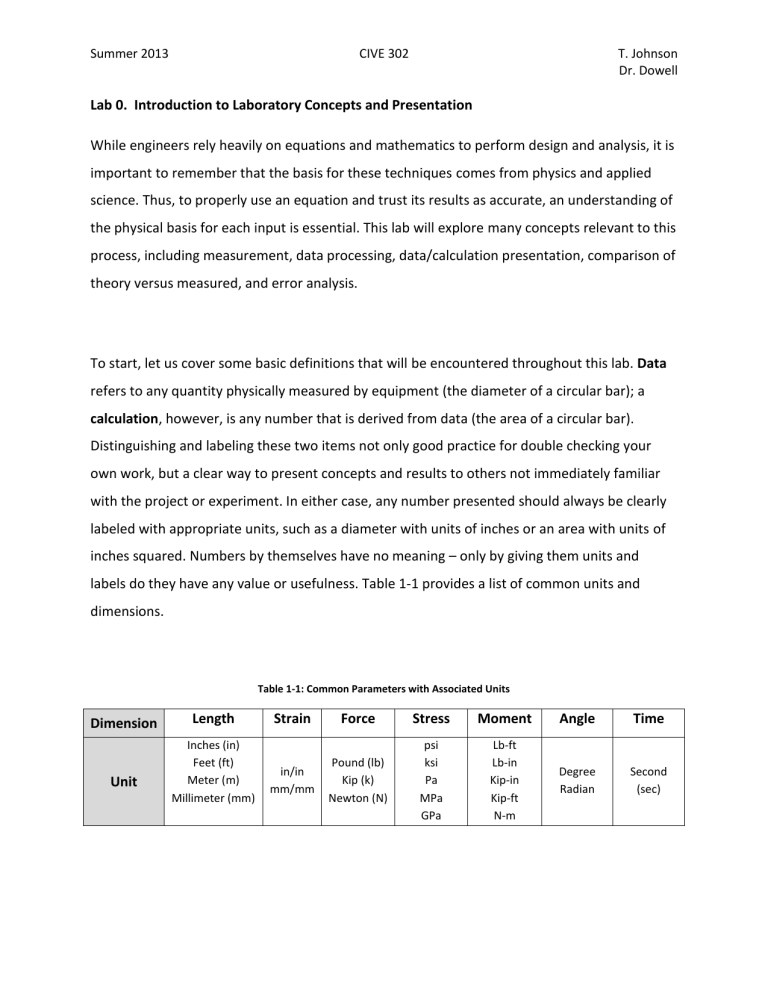
Summer 2013 CIVE 302 T. Johnson Dr. Dowell Lab 0. Introduction to Laboratory Concepts and Presentation While engineers rely heavily on equations and mathematics to perform design and analysis, it is important to remember that the basis for these techniques comes from physics and applied science. Thus, to properly use an equation and trust its results as accurate, an understanding of the physical basis for each input is essential. This lab will explore many concepts relevant to this process, including measurement, data processing, data/calculation presentation, comparison of theory versus measured, and error analysis. To start, let us cover some basic definitions that will be encountered throughout this lab. Data refers to any quantity physically measured by equipment (the diameter of a circular bar); a calculation, however, is any number that is derived from data (the area of a circular bar). Distinguishing and labeling these two items not only good practice for double checking your own work, but a clear way to present concepts and results to others not immediately familiar with the project or experiment. In either case, any number presented should always be clearly labeled with appropriate units, such as a diameter with units of inches or an area with units of inches squared. Numbers by themselves have no meaning – only by giving them units and labels do they have any value or usefulness. Table 1-1 provides a list of common units and dimensions. Table 1-1: Common Parameters with Associated Units Dimension Unit Length Inches (in) Feet (ft) Meter (m) Millimeter (mm) Strain Force Stress Moment Angle Time in/in mm/mm Pound (lb) Kip (k) Newton (N) psi ksi Pa MPa GPa Lb-ft Lb-in Kip-in Kip-ft N-m Degree Radian Second (sec) In practice, data can come in many different forms. Some measurements are discrete, single values – such as the length of beam – but others may have hundreds of thousands of measurements. An example of this is shown below Figure 1-1, which shows 3000 measured acceleration values taken over 30 seconds during the Northridge earthquake in 1994. While the actual data comes in a text file, note that it is presented in graphical format. Remember, whenever presenting numerical values in calculations, reports, or other mediums, the goal is to convey information and not to simply list numbers. In this case, we can quickly identify the approximate maximum accelerations, the distribution of acceleration over time, and the duration of the earthquake all at a glance; this is certainly more useful than listing several pages of raw spreadsheet data as presented results. 0.50 0.40 Ground Acceleration (g) 0.30 0.20 0.10 0.00 -0.10 -0.20 -0.30 -0.40 -0.50 0 5 10 15 20 25 Time (sec) Figure 1-1: Example of Continuous Data. Northridge Earthquake, Beverly Hills Station Additionally, let us look carefully at the formatting of the plot and identify several key features: - The plot has a clear title and unit-labeled x- and y- axes. 2 30 - The numerical values on the axes are listed at easy-to-read, yet still useful, intervals with an appropriate number of significant figures. - The plot is enclosed with a clearly defined border and does not have gridlines. This is prevent visual clutter; unless you have a specific need or purpose to use items like gridlines, they are discouraged. - The line representing the data is thin and clean. For multiple lines on the same plot varying, easily-readable colors and line types should be chosen. An important concept to keep in mind when working with measured numbers, too, is the concept of significant figures. Using the appropriate number of significant figures is not only beneficial in making presented values and calculations easily interpreted, but it also represents the level of confidence or accuracy in the values being presented. For example, many engineering values of relevance are taken from visual inspection off graphs; if asked to find the maximum acceleration and its associated time from Figure 1-1, how would this be approached? One could print the graph, take a ruler, and estimate about 0.4g at 8 seconds. If asked to find this directly from the data, however, the actual values are 0.4158g at 8.05 seconds. While carrying appropriate numbers of decimal places is good practice for minimizing error, be mindful of not confusing decimal place accuracy with the actual accuracy of your data or calculations. Another important concept is measurement. When reading outputs from laboratory equipment, understanding both the physics and tolerance behind how the values are being generated is vital to their proper application. Most common are either mechanical or electrical measuring devices. Mechanical devices operate using precisely-engineered intervals, such as the length intervals on a tape measure or highly sensitive springs to measurement displacements. Electrical devices, the theory behind which will be discussed later in this lab, use changes in an object’s resistance or input voltage to measure values. Using physical relationships, these electrical changes can be correlated to other quantities such as displacements, forces, or accelerations. Figure 1-2 shows a mechanical and electrical potentiometer – a displacement measuring device – placed side by side. 3 Figure 1-2: Electrical potentiometer (left). Mechanical potentiometer (right). Images and tables are often valuable tools for presentation as well. Whenever including images, be professional – posting no image is sometimes preferable to posting low resolution or blurry photos. If using images from an outside source, always cite that source. On that same note, posting random images from a search engine is in very poor taste. Also, whenever including tables or figures always provide a title/caption and discuss them in the text; if the figure is not being discussed, it should not be included in the report. When writing a laboratory report, keep in mind that it is intended to provide a technical description and presentation of an experiment or procedure. Aim to be concise and to the point, but do not sacrifice detail to so. Examples of a sentence in the experimental setup section, for example, may be: Poor Statement: “The professor set up everything in the lab.” Good Statement: “A steel coupon with threaded ends was loaded into the grips of a tension testing machine.” Note the difference in these statements beyond the obvious absurdity. The second statement notes specifics about the setup that would be required to reciprocate it in another setting: the coupon has threaded ends which, logically, must fit into grips on machine loading heads. Additionally, the coupon is 4 fixed into a machine capable of applying tensile forces to the coupon. A detailed explanation of exactly what laboratory reports for this course should contain is provided in the syllabus, but do not simply write to the template: think about the exact details of what happened in the experiment and what is needed to verbally, graphically, and logically explain this information. Lastly, think rationally about results obtained in the laboratory experiment when analyzing results. Error analysis should be far more specific than “the equipment was old” or “humans operating the equipment make mistakes.” The purpose for doing error analysis is not to simply state that numbers may or may differ from what was expected, but to examine why they differed and determine, using proper judgment, whether they are acceptable or not. Examples of questions to consider while doing error analysis are: - How were numerical values measured in the experiment? Were they approximated visually or read precisely? - What is the significant figure accuracy of the measuring equipment being used? Furthermore, what is the sensitivity of the equipment being used? - Were the calculations performed correctly? The last question is not one that should only be asked at the end of performing calculations, but one that should be asked throughout. Calculation mistakes are common and normal, but can often be caught by critically examining results. For instance, if the expected yield stress for a material is 50 ksi and you calculate 6500 ksi, this is a clear indication of a user-end mistake. Try to thoroughly analyze your own work for significant errors before attributing faulty results to other sources. EXPERIMENTS: Tour the structural engineering laboratory and examine several different pieces of measurement and testing equipment. Carefully record the order in which the tour was performed and use this as an experimental procedure. This lab will have no experimental setup or theory sections. 5 REQUIRED CALCULATIONS: Using the earthquake data provided on Blackboard, develop a scatter plot representing this information. Follow the general rules stated above to generate a properly formatted graph, complete with labeled axes, units, and distinctly labeled lines. Present this in a clearly labeled “data” section of your lab report. You will have no calculations for this lab report. REQUIRED DISCUSSION: Provide a brief description of at least three pieces of equipment and at least three measuring devices discussed in the lab. Include its proper name and how it measures or performs its function. An example of each would be: Tinius-Olsen Tension-Compression Testing Machine. Specimens are placed between two rigid loading heads. Hydraulic pressure is used to move the lower head up or down to apply loads. Electrical Potentiometer. A displacement-measuring device which tracks the elongation or contraction of a rod. Correlates changes in length to an electrical current that can be read by a computer. 6


