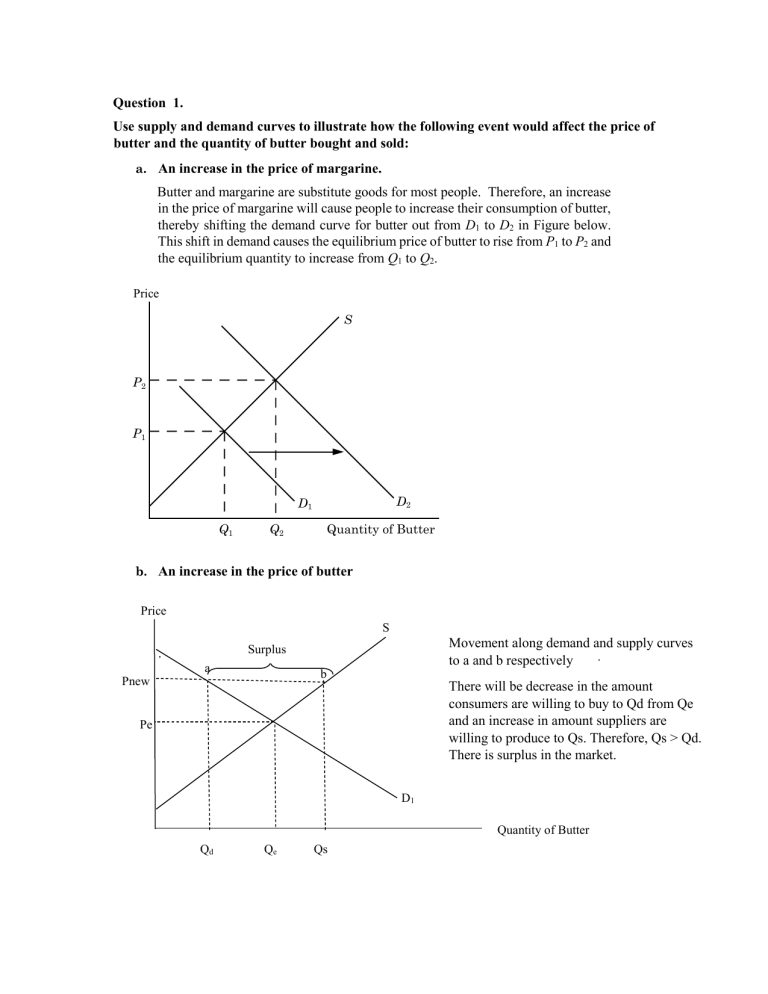
Question 1. Use supply and demand curves to illustrate how the following event would affect the price of butter and the quantity of butter bought and sold: a. An increase in the price of margarine. Butter and margarine are substitute goods for most people. Therefore, an increase in the price of margarine will cause people to increase their consumption of butter, thereby shifting the demand curve for butter out from D1 to D2 in Figure below. This shift in demand causes the equilibrium price of butter to rise from P1 to P2 and the equilibrium quantity to increase from Q1 to Q2. Price S P2 P1 D2 D1 Q1 Quantity of Butter Q2 b. An increase in the price of butter Price S Movement along demand and supply curves . to a and b respectively Surplus . a b Pnew There will be decrease in the amount consumers are willing to buy to Qd from Qe and an increase in amount suppliers are willing to produce to Qs. Therefore, Qs > Qd. There is surplus in the market. Pe D1 Quantity of Butter Qd Qe Qs c. Increase in the number of bakeries causes a fall in the price of bread. Butter and bread are complement goods for most people. Therefore, a fall in the price of bread will cause people to increase their consumption of bread and demand for butter, thereby shifting the demand curve for butter out from D1 to D2 in Figure below. This shift in demand causes the equilibrium price of butter to rise from P1 to P2 and the equilibrium quantity to increase from Q1 to Q2. Price S P2 P1 D1 Q1 Q2 D2 Quantity of Butter Question 2 solution Explain the difference between a shift in the supply curve and a movement along the supply curve. A movement along the supply curve occurs when the price of the good changes. A shift of the supply curve is caused by a change in any of the determinant other than the price of the good. Some examples are a change in the price of an input, a change in technology that reduces the cost of production and an increase in the number of firms supplying the product. Question 3 Given that the demand is Q = 300 – 2P + 4I, where I is average income measured in thousands of dollars and the supply equation is Q = 3P – 50. a. If I = 25, find the market clearing price and quantity for the product. Given I = 25, the demand curve becomes Q = 300 2P + 4(25), or Q = 400 2P. Setting demand equal to supply we can solve for P and then Q: 400 2P = 3P 50 P = 90 Q = 220. b. P=80 Qd = 300- 2(80) +4 (25) Qd = 240 Qs = 3(80) – 50 Qs = 190 When Qd > Qs , there is shortage. In this case, there is shortage of 50.


