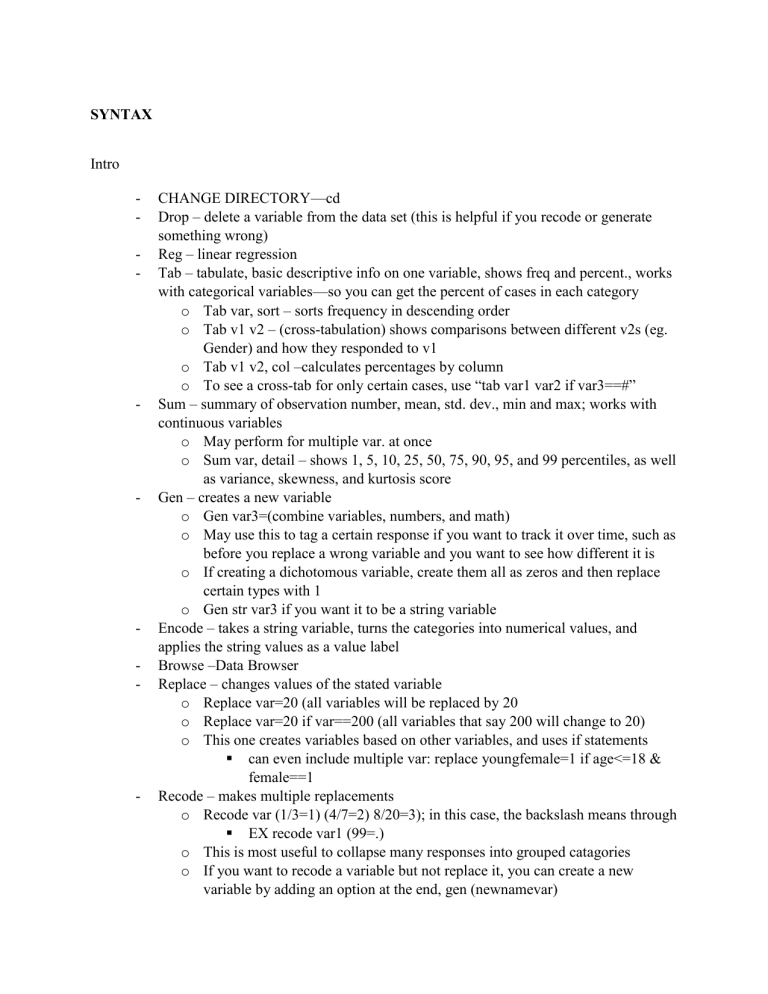
SYNTAX Intro - - - - - CHANGE DIRECTORY—cd Drop – delete a variable from the data set (this is helpful if you recode or generate something wrong) Reg – linear regression Tab – tabulate, basic descriptive info on one variable, shows freq and percent., works with categorical variables—so you can get the percent of cases in each category o Tab var, sort – sorts frequency in descending order o Tab v1 v2 – (cross-tabulation) shows comparisons between different v2s (eg. Gender) and how they responded to v1 o Tab v1 v2, col –calculates percentages by column o To see a cross-tab for only certain cases, use “tab var1 var2 if var3==#” Sum – summary of observation number, mean, std. dev., min and max; works with continuous variables o May perform for multiple var. at once o Sum var, detail – shows 1, 5, 10, 25, 50, 75, 90, 95, and 99 percentiles, as well as variance, skewness, and kurtosis score Gen – creates a new variable o Gen var3=(combine variables, numbers, and math) o May use this to tag a certain response if you want to track it over time, such as before you replace a wrong variable and you want to see how different it is o If creating a dichotomous variable, create them all as zeros and then replace certain types with 1 o Gen str var3 if you want it to be a string variable Encode – takes a string variable, turns the categories into numerical values, and applies the string values as a value label Browse –Data Browser Replace – changes values of the stated variable o Replace var=20 (all variables will be replaced by 20 o Replace var=20 if var==200 (all variables that say 200 will change to 20) o This one creates variables based on other variables, and uses if statements can even include multiple var: replace youngfemale=1 if age<=18 & female==1 Recode – makes multiple replacements o Recode var (1/3=1) (4/7=2) 8/20=3); in this case, the backslash means through EX recode var1 (99=.) o This is most useful to collapse many responses into grouped catagories o If you want to recode a variable but not replace it, you can create a new variable by adding an option at the end, gen (newnamevar) - - - EX: recode oldvar (2/3=0) (9=.), gen(newvar) Lab var – to label variables, lab var var1 “description of variable” Label values: o Lab def var1lab 0 “female” 1 “male” (defines the label and makes it available for use with any variable (eg, if yes no and maybe appear for multiple variables and you want to code as 1, 2 and 3) o Then, to see those var1lab: lab val var1 var1lab o if you need to see them without the label: tab var1, nol Missing variables—often not shown in analysis If statements o Aka “expressions” o Use double == , or <= or >= o For multiple criteria: if var==( ) & var2==( ) o & and, | or, != not equal to Math and syntax o *=multiply; <=, >= greater/less than or equal to; abs(#) =absolute value; ln(#) natural log; sqrt(#) square root o If its too long, split into two lines and type /// at the end o If you want to save a command but don’t want it to run, use /* command*/ *, /* and /* */ can be used for comments o “.” Can be for missing, but also “.s” or “.d” Checking Recodes - - Cat x cat: tab var1 var2 o List id var if var > x (use this to check who has the outlier info) o count if var1 == 0 & var2 ==1 cont x cat: bysort var2: summarize var1 o Tabstat var2, by(union) statistics(n mean sd min max), missing Cont x cont: o Summarize var1 if var2>x & ! missing(var2) o If you see it seems off, next step is to find out how many observations were off o Count if (var1==<>x) & ! missing(var1) & (var2==<>x) & ! missing(var2) o List id var1 var2 if (var1==<>x) & ! missing(var1) & (var2==<>x) & ! missing(var2) o Also, if variable values are related, could create new variable to see if they relate in the expected way: generate var3= var1 -/+ var2 Tables - Mean generalvar, over(rowvar colvar) Descriptive Stats (Univariate) - Tab1 var1 var2 var3… (shows list of tabs) Sort option shows it in descending order Tabstat var1, stat(statname) o Statnames: mean, count (of nonmissing obs), n (count), sum, max, min, range, sd, variance, semean (standard error of mean), skewness, kurtosis, p1 (first percentile), median, q (p25, p50, p75) mode?= 50th percentile - Histogram: hist var1, percent/freq xtitle( ) ytitle( ) title( ) xlabel( ) Bar graph: Box plot: graph box var1 var2 … (use for just one var or multiple if they have similar units) Graphs help to understand the distribution, broad comparisons (not precise) Graphs - Bivariate Statistical Tests - - - Between Nominal and Ordinal Variables o Tab var1 var2, col row nokey nofreq o Tab var1 var2, col expected chi gamma taub o Elaboration: testing possible confounding variables What if gender is the real reason those two are different? Tab var1 var2 if sex==1, col expected chi gamma taub (repeat with 0) OR sort var3 and then by var3: tab var1 var2, col expected chi gamma taub bysort var3: tab var1 var2, col expected chi gamma taub check if the gamma and kendall are similar, and if Chi-square is still<.05 Between Different measurement levels o Ci var1 (confidence interval, default 95, option:, level(99)) o Ttest var1, by(a dichotomous variable that you want to see if makes a difference) o Tabstat var1(DV), by(var2IV) o Anova var1 var2 (look at the p-value) (what if it is significant between some but not all?) Between Interval-ratio variables (dichotomous variables can be treated as interval ratio variables) o scatter Yaxisvar xaxisvar o Corr var2 var1 (DV IV) o Pwcorr var1 var2 var3, obs sig (pwcorr limits the listwise deletions) o Reg DV IV IV IV Beta coefficient—slope of the best fitting line; _cons—b (y=mx+b) 1 IV (bivariate) R squared value—the percent of the dependent variable that is accounted for by the IV Categorical DV: Crosstab Categorical tab DV IV, chi2 row OR tab IV DV, chi2 col Categorical (2 groups) Continuous ttest ttest DV, by(IV) Categorical (3+) Continuous ANOVA oneway DV IV, t Continuous Continuous correlation pwcorr DV IV, sig star(.05) 0-.3 weak, .3-.6 moderate, .6-1 strong, negative or positive 2+ IV (Multivariate stat) OLS/multiple/linear Reg DV IV…Look at if regression the coeff is +/- and strong/weak; interpret: a one-unit increase on the self-esteem scale (IV) is associated with a .3 decrease in delinquent acts (DV) Either continuous either Categorical Logistic regression (2 cat) Either Categorical Advanced (3+) regression (beyond this class) Normally logit command, but we will use reg command Multivariate Tests - Reg DV IV (IV…etc.) To model mediators, perform two tests, one for each relationship, based on which test is appropriate To model moderators, create dummy variables and run two different models showing what happens if mod==0 and 1 o Reg DV IV CV CV CV… if modval==0 or 1 Graphing * technically, a moderator could be continuous, but turn it into a H/L or HML - - - pie chart o graph pie, over(educCat) sort descending angle(90) plabel(_all name) intensity(inten70) title(Figure 10.6. Pie chart example: Education categories) legend(off) scheme(s1mono) bar chart o graph hbar, over(varname, sort(1) descending ytitle("Percent in each category") title("Horizontal bar chart of variable name", size(medlarge) o cat x cat: recode into dummy variables Tab varDV, gen (varstatus) Rename varstatus1 married Rename varstatus2 nevermarried Rename varstatus3 divorced o Graph bar varstatus1 varstatus2 varstatus3, over(varIV) legend(label(1 “varcat1name”) label(2 “varcat2name”) label(3 “varcat3name”)) o Cont x cat: Graph bar ageDV, over(sexIV) ytitle (“age (in years)”) o With moderator: Graph bar ageDV, over(sexIV) over(raceMOD) ytitle (“age (in years)”) RA13: create male and female dummy variables, then: Graph bar educ, over(female) over(male) over (actlim) ytitle(Education (in years)) title(Education by Activity Limitations and Sex) Scatterplot o scatter wordsum educ, mcolor(black) msize(medlarge) msymbol(oh) ytitle( "Score on vocabulary test") xtitle("Years of education") xlabel(0(100)500) jitter(7) || lfit wordsum educ, title("Figure. Scatterplot of vocabulary test score and education") legend(off) lcolor(red) lwidth(medthick) o (scatter y1 x) (scatter y2 x) OR scatter y1 x || scatter y2 x o scatter wordsum educ, mcolor(black) msize(medlarge) msymbol(oh) ytitle( "Score on vocabulary test") xtitle("Years of education") jitter(7) || qfit/lowess wordsum educ, title("Figure. Scatterplot of vocabulary test score and education") legend(off) lcolor(red) lwidth(medthick) o for moderators: twoway (scatter y1 y2 if x==1) (scatter y1 y2 if x==2) (lfit y1 y2 if x==1) (lfit y1 y2 if x==2) (y1 = x axis(normally DV) and y2 = y axis(normally IV)
