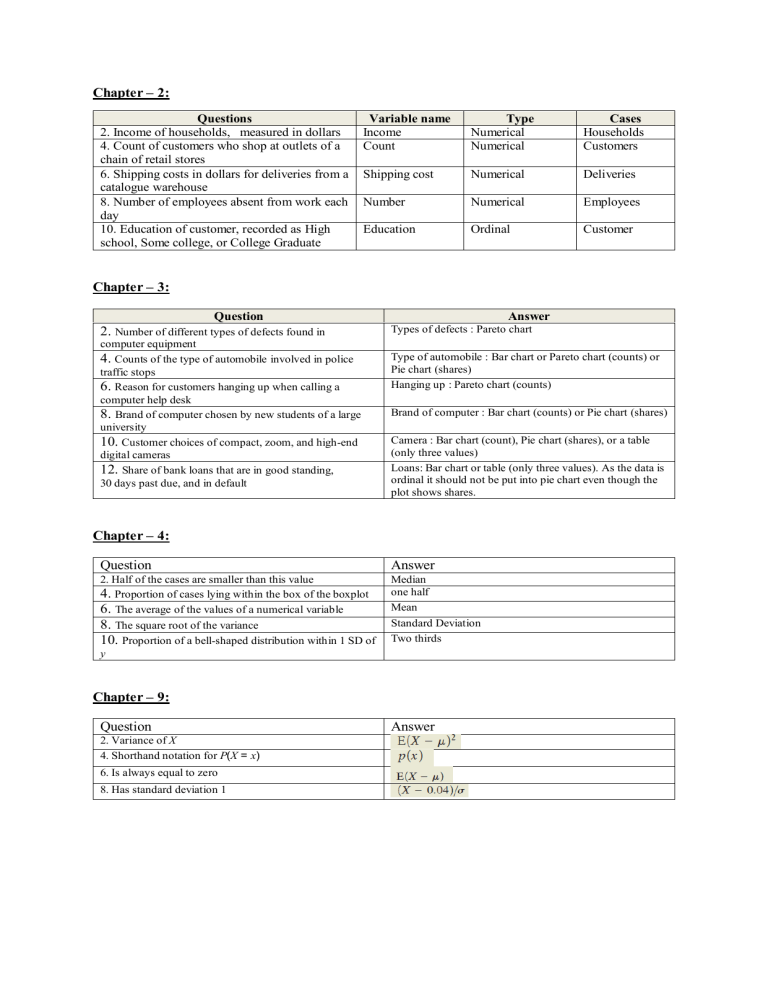
Chapter – 2: Questions 2. Income of households, measured in dollars 4. Count of customers who shop at outlets of a chain of retail stores 6. Shipping costs in dollars for deliveries from a catalogue warehouse 8. Number of employees absent from work each day 10. Education of customer, recorded as High school, Some college, or College Graduate Variable name Income Count Type Numerical Numerical Cases Households Customers Shipping cost Numerical Deliveries Number Numerical Employees Education Ordinal Customer Chapter – 3: Question 2. Number of different types of defects found in computer equipment 4. Counts of the type of automobile involved in police traffic stops 6. Reason for customers hanging up when calling a computer help desk 8. Brand of computer chosen by new students of a large university 10. Customer choices of compact, zoom, and high-end digital cameras 12. Share of bank loans that are in good standing, 30 days past due, and in default Answer Types of defects : Pareto chart Type of automobile : Bar chart or Pareto chart (counts) or Pie chart (shares) Hanging up : Pareto chart (counts) Brand of computer : Bar chart (counts) or Pie chart (shares) Camera : Bar chart (count), Pie chart (shares), or a table (only three values) Loans: Bar chart or table (only three values). As the data is ordinal it should not be put into pie chart even though the plot shows shares. Chapter – 4: Question Answer 2. Half of the cases are smaller than this value 4. Proportion of cases lying within the box of the boxplot 6. The average of the values of a numerical variable 8. The square root of the variance 10. Proportion of a bell-shaped distribution within 1 SD of y Median one half Mean Standard Deviation Two thirds Chapter – 9: Question 2. Variance of X 4. Shorthand notation for P(X = x) 6. Is always equal to zero 8. Has standard deviation 1 Answer Chapter – 12: Question Answers 2. Variance of X 4. 6. Standard deviation of Z 8. Difference between value of P(Z < -x) and value of P(Z 2/3 P(Z <1) 0.05 < x) 10. Probability that Z >1.96 plus the probability that Z < - 0 1.96 Chapter – 13: Question Answers 2. Census 4. Statistic 6. Sampling frame 8. Stratified sample 10. Nonresponse A comprehensive study of every item in a population A characteristic of a sample A list of all of the items in the population A sample from a homogeneous subset of the population The result if a respondent chooses not to answer questions Chapter – 14: Question 2. Which of the following X-bar charts show that a process went out of control? 4. Which, if any, of these combinations of an X-bar chart and an S-chart suggest a problem? If there’s a problem, did you find it in the X-bar chart, the S-chart, or both? Answer A, B, D a) In X-bar chart, the process lies between control limits, hence in control while in S-chart, the process goes above upper control limit, hence out of control. Therefore, Schart suggests a problem. b) In X-bar chart, the process goes below lower control limit, hence out of control while in S-chart, the process goes above upper control limit, hence out of control. Therefore, both X-bar and S-charts suggest a problem. c) In X-bar chart, the process lies between control limits, hence in control while in S-chart, the process goes above upper control limit, hence out of control. Therefore, Schart suggests a problem. d) In X-bar chart, the process goes above upper control limit, hence out of control while in S-chart, the process lies between control limits, hence in control. Therefore, X-bar chart suggests a problem. Chapter – 15: Question Answer 2. 100% confidence interval for p 4. 6. 8. [0,1] 10. Sampling distribution of X Actual standard error of Y An interval with 68% coverage About 2 for moderate sample sizes Chapter – 16: Question 2. Common symbols for the alternative hypothesis 4. Number of standard errors that separate an observed statistic from the boundary of H0 6. Largest α-level for which a test rejects the null hypothesis 8. Occurs if the p-value is larger than a when H0 is false 10. Indicates a statistically significant result Answer z-statistic p-value Type II error p-value < α Chapter – 17: Question 2. Difference between the averages in two samples 4. Name given to the variable that specifies the treatments in an experiment 6. Avoids confounding in a two-sample comparison 8. Test statistic indicating that a mean difference is not statistically significant if α = 0.05 10. Multiple factors explain the difference between two samples Answer Factor Randomization t = 1.3 Confounding Chapter – 18: Question 2. Number of constraints on frequencies in the chi-squared test of goodness of fit of a binomial distribution 4. P-value if χ2 = 16.812 when testing the null hypothesis that a categorical variable with 7 levels has a uniform distribution 6. Impossible value for χ2 8. Reject the null hypothesis of independence in a 6 * 3 contingency table if χ2 is larger than this value and α = 0.01 10. Number of degrees of freedom if using chi-squared to test whether four proportions are the same Answer 2 0.01 -1 23.209 3 Chapter – 19: Question Answer 2. Symbol for the response in a regression Y 4. Residual from an estimated regression equation 6. Identifies the slope in a fitted line 8. Symbol for the standard deviation of the residuals b1 10. Prediction from a fitted line if x = 1 b0 + b1 Chapter – 21: Question 2. Not straight enough to fit a line 4. Not similar variances 6. Not nearly normal 8. Standard deviation of errors 10. Ratio of b1 to its standard error 12. Approximate prediction interval Answer
