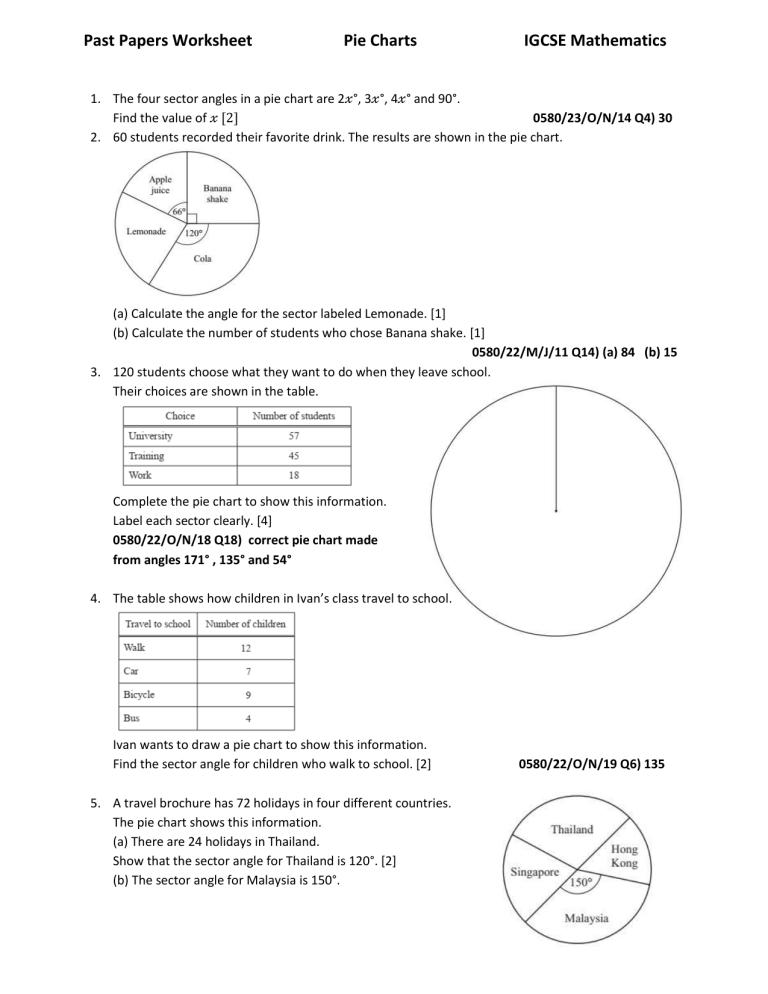
Past Papers Worksheet Pie Charts IGCSE Mathematics 1. The four sector angles in a pie chart are 2𝓍°, 3𝓍°, 4𝓍° and 90°. Find the value of 𝓍 [2] 0580/23/O/N/14 Q4) 30 2. 60 students recorded their favorite drink. The results are shown in the pie chart. (a) Calculate the angle for the sector labeled Lemonade. [1] (b) Calculate the number of students who chose Banana shake. [1] 0580/22/M/J/11 Q14) (a) 84 (b) 15 3. 120 students choose what they want to do when they leave school. Their choices are shown in the table. Complete the pie chart to show this information. Label each sector clearly. [4] 0580/22/O/N/18 Q18) correct pie chart made from angles 171° , 135° and 54° 4. The table shows how children in Ivan’s class travel to school. Ivan wants to draw a pie chart to show this information. Find the sector angle for children who walk to school. [2] 5. A travel brochure has 72 holidays in four different countries. The pie chart shows this information. (a) There are 24 holidays in Thailand. Show that the sector angle for Thailand is 120°. [2] (b) The sector angle for Malaysia is 150°. 0580/22/O/N/19 Q6) 135 The sector angle for Singapore is twice the sector angle for Hong Kong. Calculate the number of holidays in Hong Kong. [3] 0580/21/M/J/14 Q17 (b) 6 6. Michelle sells ice cream. The table shows how many of the different flavours she sells in one hour. Michelle wants to show this information in a pie chart. Calculate the sector angle for mango. [2] 0580/23/M/J/14 Q2) 84 7. In a survey of 60 cars, the type of fuel that they use is recorded in the table below. Each car only uses one type of fuel. (b) Olav drew a pie chart to illustrate these figures. Calculate the angle of the sector for Diesel. [2] 0580/22/O/N/11 Q16 (b) 72 8. Bruce plays a game of golf. His scores for each of the 18 holes are shown below. 2 3 4 5 4 6 2 3 4 4 5 3 4 3 5 4 4 4 The information is to be shown in a pie chart. Calculate the sector angle for the score of 4. [2] 0580/22/O/N/13 Q4) 160 9. The table shows information about the time, t minutes, taken for each of 150 girls to complete an essay. (c) Rafay looks at the frequency table. (ii) He draws a pie chart to show this information. Calculate the sector angle for the interval 65 < t ≤ 70 minutes. [2] 0580/43/O/N/17 Q4(c)(ii) 62.4 10. 40 people were asked how many times they visited the cinema in one month. The table shows the results. (b) Omar wants to show the information from the table in a pie chart. Calculate the sector angle for the people who visited the cinema 5 times. [2] 0580/21/M/J/18 Q23 (b)27 11. (a) In a football league a team is given 3 points for a win, 1 point for a draw and 0 points for a loss. The table shows the 20 results for Athletico Cambridge (ii) Thomas wants to draw a pie chart using the information in the table. Calculate the angle of the sector which shows the number of times Athletico Cambridge were given 1 point. [2] 0580/43/M/J/12 Q4(a) (ii) 54 12. The pie charts show information on the grades achieved in mathematics by the girls and boys at a school. (a) For the Girls’ pie chart, calculate (i) 𝓍, [2] (ii) the angle for grades B, C or D.[1] (b) Calculate the percentage of the Boys who achieved grades E, F or G. [2] (c) There were 140 girls and 180 boys. (i) Calculate the percentage of students (girls and boys) who achieved grades A or A*. [3] (ii) How many more boys than girls achieved grades B, C or D? [2] 0580/41/O/N/12 Q1) (a) (i) 126 (ii) 144 (b) 16.7 (c) (i) 22.2 (ii) 58


