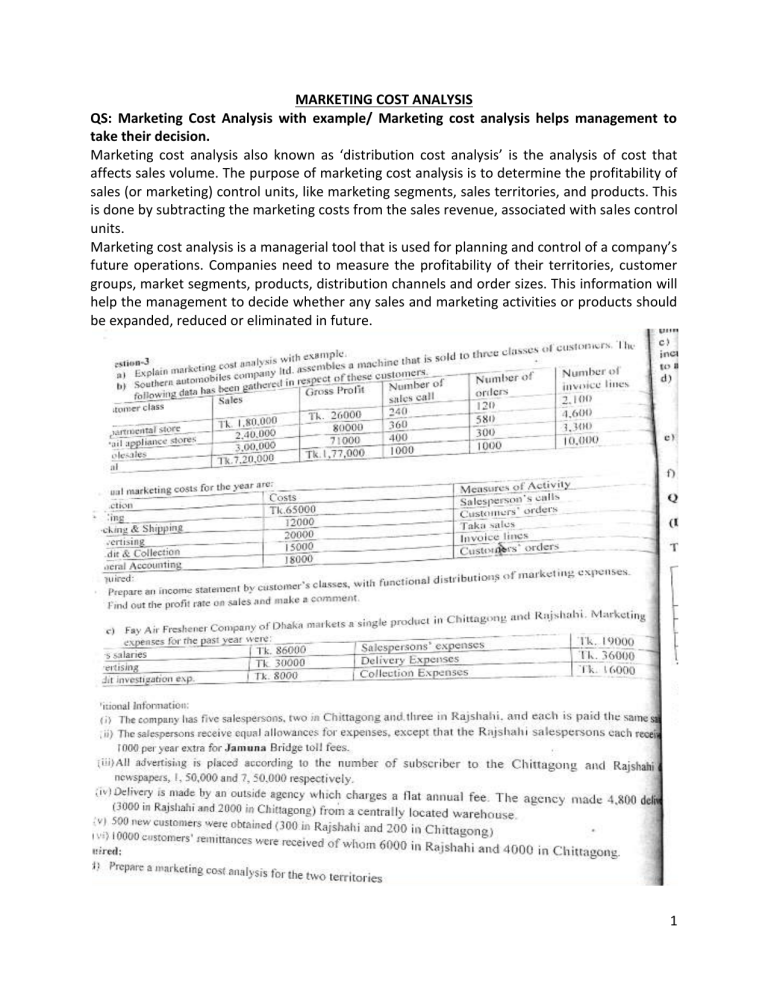
MARKETING COST ANALYSIS QS: Marketing Cost Analysis with example/ Marketing cost analysis helps management to take their decision. Marketing cost analysis also known as ‘distribution cost analysis’ is the analysis of cost that affects sales volume. The purpose of marketing cost analysis is to determine the profitability of sales (or marketing) control units, like marketing segments, sales territories, and products. This is done by subtracting the marketing costs from the sales revenue, associated with sales control units. Marketing cost analysis is a managerial tool that is used for planning and control of a company’s future operations. Companies need to measure the profitability of their territories, customer groups, market segments, products, distribution channels and order sizes. This information will help the management to decide whether any sales and marketing activities or products should be expanded, reduced or eliminated in future. 1 (b) Solution: Cost Per Driver: Selling cost = $65,000 / 10,000 calls = $65 per call Packing and shipping cost = $12,000/1000 orders = $12 per order Credit and Allocation cost = $15,000/10,000 invoice line = $1.5 per invoice line General accounting cost = $18,000/1000 orders = $18 per order Advertising : Dept. Store = $1,80,000/$7,20,000 = 0.25 Retail Store = $2,40,000/$7,20,000 = 0.33 Wholesaler = $3,00,000/$7,20,000 = 0.42 Income Statement by Customer Classes Particulars Sales -COGS Gross Profit Marketing Expenses: Selling Cost: Dept Store: $65 per call X 240 calls Retail store: $65 per call X 360 calls Wholesale: $65 per call X 400 calls Packing & Shipping: Dept Store: $12 per order X 120 orders Retail store: $12 per order X 580 orders Wholesale: $12 per order X 300 orders Advertising: Dept Store: 0.25 X $20,000 Retail store: 0.33 X $20,000 Wholesale: 0.42 X $20,000 Audit & Collection: Dept Store: $1.5 per invoice line X 2100 lines Retail store: $1.5 per invoice line X 4600 lines Wholesale: $1.5 per invoice line X 3300 lines General Accounting: Dept Store: $18 per order X 120 order Retail store: $18 per order X 580 order Wholesale: $18 per order X 300 order Total Marketing Cost Profit Profit Rate on Sales Total 7,20,000 5,43,000 1,77,000 Dept. Store 1,80,000 1,54,000 26,000 Retail Store 2,40,000 1,60,000 80,000 Wholesale 3,00,000 2,29,000 71,000 65,000 15,600 23,400 26,000 12,000 1440 6960 3600 20,000 5000 6600 8400 15,000 3150 6900 4950 18,000 2160 10440 5400 $54,300 $25,700 25,700÷ 2,40,000 =10.7% $48,350 $22,650 22,650÷ 3,00,000 =7.55% $1,30,000 $27,350 $47,000 -$1350 -1350÷ 1,80,000 =-0.75% Comment: Among the three customers Retail store is highly profitable and departmental store is unprofitable for the firm. Company is generating 10.7% return on sales of retail store whereas it is 7.55% from the wholesaler. Though the highest sales is generated from wholesale customer however direct cost i.e. COGS of wholesale customer is higher (76% of sales) compared to retail customer which is 67% of sales. Despite marketing cost being highest for retail customer, it is found to be the most profitable customer group due to its lower level direct cost (COGS). The firm is generating least sales from department store and the direct cost to sales ratio is also highest (86% of sales) for this customer group. 2 (c) Solution: Marketing Cost Analysis by Sales Territory Particulars Salaries: Ctg: $86,000 X (2/5) Rajshahi: $86,000 X (3/5) Sales Person Expenses: Ctg: $16,000 X (2/5) Rajshahi: $16,000 X (3/5)+ [1000 X 3] Advertising: Ctg: $30,000 X (1,50,000/9,00,000) Rajshahi: $30,000 X (7,50,000/9,00,000) Delivery Expense: Ctg:$36,000 X (1800/4800) Rajshahi: $36,000 X (3000/4800) Audit Investigation Exp: Ctg: $8,000 X (200/500) Rajshahi: $8,000 X (300/500) Collection Expense: Ctg:$16,000 X (4000/10,000) Rajshahi: $16,000 X (6000/10,000) Total Marketing Cost Total 86,000 Chittagong Rajshahi 34,400 51,600 19,000 6400 12,600 30,000 5000 25,000 36,000 13,500 22,500 8000 3200 4800 16,000 6400 9600 $1,95,000 $68,900 $1,26,100 Comment: Marketing cost of Rajshahi is higher than the Chittagong territory. Since the number of customers are more in Rajshahi (300 customers) compared to Chittagong (200 customers), hence, cost related to selling, distribution and marketing also got increased for Rajshahi. Given, the sales revenue, it can be identified which territory is more profitable. 3 4 (b) SOLUTION: Working for Sales Commission Ctg Dhaka Rajshahi P1 (10000X0) +(30000X0.03) +(16000X0.06) =1860 (10000X0) +(7000X0.03) =210 (10000X0) +(30000X0.03) +(10000X0.06) =1500 P2 (10000X0) +(18000X0.03) =540 P3 P4 (10000X0) (4000X0) +(15000X0.03) =0 =450 (10000X0) (10000X0) 0 +(10000X0.03) +(30000X0.03) =300 +(8000X0.06) =1380 (10000X0) 0 0 +(30000X0.03) +(7000X0.06) =1320 P5 Total (10000X0) $3300 +(15000X0.03) =450 0 $1890 0 $2820 Income Statement by Sales Territory Particulars Sales - Sales & Marketing Expenses Sales Commission: (working) Salaries: Ctg:60,000 X (5/10) Dhk:60,000 X (3/10) Ctg:60,000 X (2/10) Advertising Expenses: Ctg:20,000 X (138,000/320,000) Dhk:20,000 X (85,000/320,000) Raj:20,000 X (97,000/320,000) Travelling Expenses: Ctg:3650 X (5/10) Dhk:3650 X (3/10) Ctg:3650 X (2/10) Warehouse Expenses: Fixed Variable: Ctg:1710 X (5/10) Dhk:1710 X (3/10) Ctg:1710 X (2/10) Delivery Expenses: Ctg: 1500 X 0.40 Dhk: 1500 X 0.30 Ctg: 1500 X 0.30 Collection Expenses: Ctg:1675 X (10000/20000) Dhk:1675 X (4000/20000) Ctg:1675 X (6000/20000) Total Marketing Cost Profit Per State Marketing cost % Sales Total 3,20,000 Chittagong 1,38,000 Dhaka 85,000 Rajshahi 97,000 8010 60,000 3300 30,000 1890 18,000 2820 12,000 20,000 8625 5312.5 6062.5 3650 1825 1095 730 450 1710 250 855 100 513 100 342 1500 600 450 450 1675 837.5 335 502.5 $96,995 $46,292.5 $2,23,005 $91,707.5 33.5% $27,695.5 $23,007 $57,304.5 $73,993 32.6% 23.7% 5 Comment: Though marketing cost as a percentage of sales is highest for Chittagong, but this territory generates the largest revenue resulting in as the most profitable sales territory. Rajshashi generates more revenue compared Dhaka and also reports lower marketing cost as a percentage of sales and hence Rajshahi is recorded as the second most profitable territory. Dhaka is found to be least profitable among three sales territories. QS 1. 6 Required: (1) Compute for April, gross margin and operating income of each distribution channel using activity based costing information. (ii) Calculate gross margin percentage and percentage of operating expense for each distribution channel. What new insights are available with the activity –based cost information? SOLUTION: Working: Cost Per Driver Customer Purchase order processing= $220,000/5500 orders = $40 per order Line-item ordering = $175,560/58,520 line items = $3 per line item order Store delivery = $195,250/3905 store deliveries = $50 per delivery Cartons dispatched = $209,000/209,000 dispatches = $1 per dispatch Shelf-stocking at customer store = $28,160/1760 hours = $16 per hour 7 Income Statement by Distribution Channel Revenues:Supermkt:330 delivery X $84,975 Drugstore: 825 X $28,875 Chemist:2750 X $5445 Less: COGS: Supermkt: 330 delivery X $82,500 Drugstore: 825 X $27,500 Chemist:2750 X $4950 Gross Margin Less: Operating Costs: Customer purchase order processing: Supermkt:$40 per order X 385 orders Drugstore: $40 per order X 990 orders Chemist: $40 per order X 4125 orders Line item ordering Supermkt: $3 per line item order X 14 line items per order X 385 orders Drugstore: $3 X 12 X 990 orders Chemist: $3 X 10 X 4125 orders Store delivery Supermkt: $50 per delivery X 330 deliveries Drugstore: $50 X 825 deliveries Chemist: $50 X 2750 deliveries Cartons dispatched to store Supermkt: $1 per dispatch X 300 Cartons per delivery X 330 deliveries Drugstore:$1 X 80 X 825 Chemist: $1 X16 X 2750 Shelf stocking at customer store Supermkt:$16 per hour X 3 hour X 330 deliveries Drugstore:$16 p/hX 0.6 hour X 825 delivery Chemist:$16 p/hX 0.1 hour X2750 delivery Total Operating Costs Operating Income Gross Margin % of Sales Revenue Operating Expenses % Sales Revenue Operating Income % Sales Revenue Supermarket $280,41,750 Drugstore $238,21,875 Chemist 149,73,750 Total 668,37,375 $272,25,000 $226,87,500 $136,12,500 $635,25,000 $816,750 $11,34,375 $13,61,250 $33,12,375 15,400 39,600 165,000 16,170 35,640 123,750 16,500 41,250 137,500 99,000 66,000 44,000 15,840 7,920 4,400 162,910 653,840 2.91% 0.58% 2.33% 190,410 943,965 4.76% 0.8% 3.96% 474,650 886,600 9.09% 3.17% 5.96% $827,970 $24,84,405 4.96% 1.24% 3.72% Comments and Insights : The activity based cost information highlights, how the Chemist shop uses a larger amount of RST ltd’s operating resources per revenue (3.17%) than do the other two distribution channels which is reported through operating expenses as a percentage of revenue. 8
