International Journal of Trend in Scientific Research and Development (IJTSRD)
Volume 4 Issue 5, July-August 2020 Available Online: www.ijtsrd.com e-ISSN: 2456 – 6470
Analysis on the Influencing Factors of Undergraduates'
Willingness to take Postgraduate Entrance
Examination in Local Universities
Chen Rong
Department of Physics, Nanchang Normal University, Nanchang, China
ABSTRACT
In order to understand the students' willingness to take the postgraduate
entrance examination (PEE) and better provide the corresponding guidance
for the students. Taking the undergraduates of Nanchang Normal University as
the research object, this paper collects data by means of questionnaire survey.
Through the analysis of various factors and the willingness to take the PEE,
universities, departments, teachers and students can all understand their roles
and know which factors have an impact on the willingness of PEE, so as to
improve the PEE rate and provide high-level qualified talents for the society.
How to cite this paper: Chen Rong
"Analysis on the Influencing Factors of
Undergraduates' Willingness to take
Postgraduate Entrance Examination in
Local Universities"
Published in
International Journal
of Trend in Scientific
Research
and
Development (ijtsrd),
ISSN:
2456-6470,
Volume-4 | Issue-5,
August
2020,
IJTSRD33232
pp.1710-1713, URL:
www.ijtsrd.com/papers/ijtsrd33232.pdf
KEYWORDS: local universities, undergraduates, willingness, postgraduate
entrance examination, influencing factors
1. INTRODUCTION
Employment has become extremely severe which affected by
the epidemic situation this year. Students graduated from
university without work experience, so the employment
difficulties of university students have become particularly
prominent. University students realize that can have a
foothold in this society only by further study. In order to
alleviate the employment problem of college students, the
government and the university formulate a series of policies
and measures to help college students get employed. So
many college students begin to plan for the PEE as soon as
they enter the university, they want to change their destiny
by taking the PEE. Over time, the PEE is popular in the whole
university campus. At the same time, many senior students
are worried about their future, so they are at a loss whether
to choose to graduate for employment or to continue to
Question
option
Male
Female
countryside
Hometown
town
Total
Sex
@ IJTSRD
|
Copyright © 2020 by author(s) and
International Journal of Trend in Scientific
Research and Development Journal. This
is an Open Access article distributed
under the terms of
the
Creative
Commons Attribution
License
(CC
BY
4.0)
(http://creativecommons.org/licenses/by
/4.0)
study in PEE. In order to understand the students'
willingness to take the PEE, better provide corresponding
guidance for students, and provide reference for a series of
activities held by universities.
2. Survey objects and methods
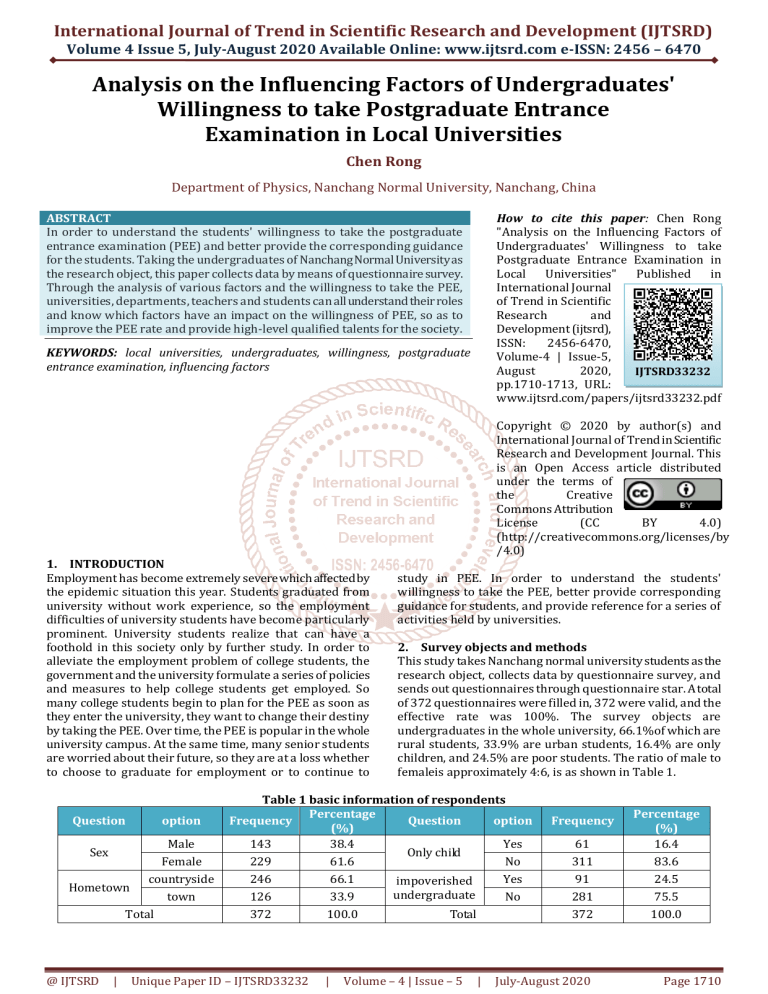
This study takes Nanchang normal university students as the
research object, collects data by questionnaire survey, and
sends out questionnaires through questionnaire star. A total
of 372 questionnaires were filled in, 372 were valid, and the
effective rate was 100%. The survey objects are
undergraduates in the whole university, 66.1%of which are
rural students, 33.9% are urban students, 16.4% are only
children, and 24.5% are poor students. The ratio of male to
femaleis approximately 4:6, is as shown in Table 1.
Table 1 basic information of respondents
Percentage
Frequency
Question
option
(%)
143
38.4
Yes
Only child
229
61.6
No
246
66.1
Yes
impoverished
undergraduate
126
33.9
No
372
100.0
Total
Unique Paper ID – IJTSRD33232
|
Volume – 4 | Issue – 5
|
Frequency
61
311
91
281
372
July-August 2020
Percentage
(%)
16.4
83.6
24.5
75.5
100.0
Page 1710
International Journal of Trend in Scientific Research and Development (IJTSRD) @ www.ijtsrd.com eISSN: 2456-6470
3. Statistics and analysis
A. Willingness to take the PEE
From the results of the survey in Table 2,there are five options in the item of willingness to take the PEE, which are: very want
to take an exam, comparatively want to take an exam, general, relatively do not want to take the exam, and very do not want to
take the exam.61% of the respondents chose "very want to take the exam" and "comparatively want to take the exam";11.3% of
the respondents chose "relatively do not want to take the exam" and "very do not want to take the exam". Therefore, it shows
that most students are willing to take the PEE, in the process of teaching, teachers should integrate the examination questions
of PEE over the years.
option
very want to take the exam
comparatively want to take the exam
general
relatively do not want to take the exam
very do not want to take the exam
Total
Table 2 willingness to take the PEE
Frequency Percentage Effective percentage
97
26.1
26.1
130
34.9
34.9
103
27.7
27.7
35
9.4
9.4
7
1.9
1.9
372
100.0
100.0
Cumulative percentage
26.1
61.0
88.7
98.1
100.0
B. The most important factors influencing the willingness to take the PEE
As can be seen from Table 3, 41.7% of the students have the willingness to take the PEE due to the great employment pressure
and 29.6% of the students want to continue their further study. Therefore, 71.3% of the students who want to take the PEE are
due to employment pressure or want to continue their further study.
Table 3 the most important factors influencing the willingness of PEE
option
Frequency Percentage (%) Effective percentage (%) Cumulative percentage (%)
employment pressure
155
41.7
41.7
41.7
Further study
110
29.6
29.6
71.2
Parents' expectations
25
6.7
6.7
78.0
follow the fashion
2
.5
.5
78.5
Lack of interest in major
54
14.5
14.5
93.0
other
26
7.0
7.0
100.0
total
372
100.0
100.0
C. The most important factors in choosing major for PEE
It can be seen from Table 4 that 51.1% of them chose "employment prospect", 25.8% chose "interest" and 20.7% chose
"probability of taking an examination" among the most important factors in choosing a major for PEE. It shows that the PEE is
mostly based on the future employment prospects after graduation.
Table 4 the most important factors in choosing major for PEE
Percentage
Effective
option
Frequency
(%)
percentage (%)
Employment prospects
190
51.1
51.1
interest
96
25.8
25.8
Probability of passing the examination
77
20.7
20.7
other
9
2.4
2.4
total
372
100.0
100.0
Cumulative
percentage (%)
51.1
76.9
97.6
100.0
D. The influence of love on the willingness of PEE
It can be seen from Table 5 that the Pearson correlation coefficient between love and willingness of PEE is r = 0.128, P = 0.013 <
0.05, it shows that there is a correlation between them and it is significant at 0.05 level. Love object is self-motivated, can work
together, support each other and make progress together. This kind of love relationship can promote the willingness of PEE.
Table 5 correlation between love and the willingness of PEE
Love the willingness of PEE
Love
1
.128*
the willingness of PEE .128*
1
*. it is significant at 0.05 level.
E. The effect of college satisfaction on the willingness to take the PEE
It can be seen from table 6 that the Pearson correlation coefficient between college satisfaction and the willingness to take the
PEE is r = 0.020, P = 0.703 > 0.05, which indicates that it’s not significant between them.
@ IJTSRD
|
Unique Paper ID – IJTSRD33232
|
Volume – 4 | Issue – 5
|
July-August 2020
Page 1711
International Journal of Trend in Scientific Research and Development (IJTSRD) @ www.ijtsrd.com eISSN: 2456-6470
Table 6correlation between college satisfaction and willingness to take PEE (N = 372)
College satisfaction willingness to take PEE
Pearson correlation
1
.020
College satisfaction
Significance (bilateral)
.703
Pearson correlation
.020
1
willingness to take PEE
Significance (bilateral)
.703
F. The correlation between family's attention to study and the willingness to take PEE
The more attention the family attached to their studies, the stronger their willingness to take the PEE. It can be seen from Table
7 that the Pearson correlation coefficient between family's emphasis on school work and willingness to take PEE is r = 0.252, P
= 0.000 < 0.01, and there is a significant correlation between them at the level of. 01 (bilateral).
Table 7 the correlation between family's emphasis on their studies and their willingness to take the PEE
Family's emphasis on study willingness to take PEE
Pearson correlation
1
.252**
Family's emphasis on study Significance (bilateral)
.000
N
372
372
Pearson correlation
.252**
1
willingness to take PEE
Significance (bilateral)
.000
N
372
372
**. it is significant at 0.01 level.
G. The correlation between perseverance and willingness to take the PEE
The most taboo thing for PEE is "fishing for three days and sunning his net for two days". It can be seen from Table 8 that
Pearson correlation coefficient is r = 0.312, P = 0.000 < 0.01 between perseverance and willingness to take the PEE, and there is
a significant correlation between them at the level of 0.01 (bilateral).
Table 8 correlation between perseverance and willingness to take the PEE
perseverance willingness to take the PEE
Pearson correlation
1
.312**
perseverance
Significance (bilateral)
.000
N
372
372
**
Pearson correlation
.312
1
willingness to take the PEE Significance (bilateral)
.000
N
372
372
**. it is significant at 0.01 level.
H. The correlation between the understanding degree of PEE and the willingness of PEE
It can be seen from Table 9 that Pearson correlation coefficient is r = 0.330, P = 0.000 < 0.01 between the understanding degree
of PEE and the willingness of PEE, and there is a significant correlation between them at the level of 0.01 (bilateral).
Table 9 the correlation between the understanding degree of PEE and the willingness of PEE
understanding degree of PEE willingness of PEE
Pearson correlation
1
.330**
understanding degree of PEE Significance (bilateral)
.000
N
372
372
Pearson correlation
.330**
1
willingness of PEE
Significance (bilateral)
.000
N
372
372
**. it is significant at 0.01 level.
4. correlation analysis
Table 10 shows that the Pearson Correlation Coefficient between family economy, employment situation of Undergraduates
and the willingness of PEE is r = 0.044, p = 0.400; r = 0.003, p = 0.958; r = 0.020, p = 0.703.Therefore, there is no correlation
between family economy, Undergraduate Employment Situation and the willingness of PEE, it’s not significant. The Pearson
Correlation Coefficient between other factors and the willingness of PEE is more than 0.112, and the significance P is less than
0.05.
@ IJTSRD
|
Unique Paper ID – IJTSRD33232
|
Volume – 4 | Issue – 5
|
July-August 2020
Page 1712
International Journal of Trend in Scientific Research and Development (IJTSRD) @ www.ijtsrd.com eISSN: 2456-6470
Table 10 correlation and significant relationship between factors and willingness to take PEE (n = 372)
Pearson
Significance
Pearson
Significance
Question
Question
correlation
(bilateral)
correlation
(bilateral)
Family economy
.044
.400
Family support
.408**
.000
Grades ranked in the
.299**
.000
English score ranking
.195**
.000
class
Mathematics score
.210**
.000
Class learning atmosphere
.182**
.000
ranking
Frequency of
Professional knowledge
communication with
.216**
.000
.262**
.000
learning
parents
Satisfaction with current
learning ability
.362**
.000
.222**
.000
major
employment
The influence of
situation of
.003
.958
educational background on
.230**
.000
Undergraduates
Employment
employment
Understanding of graduate
prospect of graduate
.155**
.003
.263**
.000
employment
students
Attitude towards the
Exchange of experience in
.166**
.001
.262**
.000
situation of PEE
PEE
The number of
The influence of your
students who
.240**
.000
classmates’ willingness to
.348**
.000
willingness to take
take the PEE
the PEE
Teacher's
The importance of
.409**
.000
.112*
.030
encouragement
attending college
**. it is significant at 0.01 level,*. it is significant at 0.05 level.
5. Suggestions on improving the willingness of PEE
At the school level, it is necessary to create a good study
atmosphere and academic atmosphere to help students
continuously enhance their academic interest. At the level of
departments, we should do a good job in publicity and
education of PEE, hold mobilization meeting for PEE and do
a good job in consulting service for PEE, so that students can
understand relevant information. Teachers should help
students to establish a correct view of PEE, who should pay
attention to the guidance of students in the process of
teaching, and help students overcome the fear of difficulties.
Students should make a scientific review plan, arrange study
and rest time reasonably, and enhance their faith and
perseverance.
6. Conclusion
Through the analysis of various factors and the willingness
to take the PEE, universities, departments, teachers and
students can all understand their roles and know which
factors have an impact on the willingness of PEE. In future
work and study, targeted organization of teaching activities
will play a multiplier role with half the effort. So as to
improve the PEE rate and provide high-level qualified talents
for the society.
ACKNOWLEDGMENT
Project supported by Training program for college students
in Jiangxi Province (Grant No.S202014437003), by the
@ IJTSRD
|
Unique Paper ID – IJTSRD33232
|
research on teaching reform of Nanchang Normal
University(Grant No.JGKT-19-12) and also by the research
on science and technology of Nanchang Normal
University(Grant No.18KJYB05).the students' learning has
become more active, the effect of teaching has been
improved by it.
References
[1] Chen, R. (2020) Study on the Influencing Factors of
Teaching Effect of University Teachers during the
Period of the Epidemic. Open Access Library Journal, 7:
e6604. https://doi.org/10.4236/oalib.1106604
[2] Chen, R. (2020) Analysis and Prediction of the Final
Grade of Securities and Futures Based on SPSS.
International Journal of Trend in Scientific Research
and Development, 4, 394-396.
[3] Sujatha Manohar,Varisha Rehman, Bharadhwaj
Sivakumaran.(2021)Role of unfamiliarity and
information on consumers’ willingness to try new
healthy foods. Food Quality and Preference.
https://doi.org/10.1016/j.foodqual.2020.104037
[4] Zheng-Yan Shi, Xiao-Ling Li, Meng-Yan Tang, et al.
Investigation and Analysis of Undergraduate Nursing
Students’ Attitudes Toward Advanced Care Planning
and Their Willingness to Implement. 2020, 37(8):613618. https://doi.org/10.1177/1049909120902123
Volume – 4 | Issue – 5
|
July-August 2020
Page 1713


