International Journal of Trend in Scientific Research and Development (IJTSRD)
Volume 4 Issue 5, July-August 2020 Available Online: www.ijtsrd.com e-ISSN: 2456 – 6470
Effect of Endurance on Gastrocnemius Muscle with
Exercise by Employing EMG Amplitude Parameters
Gaurav Patti, Poonam Kumari
University Centre of Instrumentation and Microelectronics, Panjab University, Chandigarh, India
ABSTRACT
Muscle fatigue is a common experience in daily life. Many authors have
defined it as the incapacity to maintain the required or expected force, and
therefore, force, power and torque recordings have been used as direct
measurements of muscle fatigue. In addition, the measurement of these
variables combined with the measurement of surface electromyography
(sEMG) recordings (which can be measured during all types of movements)
during exercise may be useful to assess and understand muscle fatigue.
How to cite this paper: Gaurav Patti |
Poonam Kumari "Effect of Endurance on
Gastrocnemius Muscle with Exercise by
Employing EMG Amplitude Parameters"
Published
in
International
Journal of Trend in
Scientific Research
and
Development
(ijtsrd), ISSN: 2456IJTSRD33222
6470, Volume-4 |
Issue-5,
August
2020,
pp.1564-1570,
URL:
www.ijtsrd.com/papers/ijtsrd33222.pdf
EMG signal can be easily analyzed in time domain, frequency domain and
time-frequency domain. The time domain features are the most popular in
EMG pattern recognition because they are easy and quick to calculate and
they do not require a transformation. The purpose of this study was to
analyze the fatigue and to study the endurance occurrence in the
Gastrocnemius muscle with a pre-defined exercise protocol for the targeted
muscle. For this purpose, sEMG Amplitude parameters were characterized.
Relation between EMG features like mean, force, standard deviation, etc. is
verified for fatigue detection as well as to identify the Endurance developed
in the Gastrocnemius muscle.
Copyright © 2020 by author(s) and
International Journal of Trend in
Scientific Research and Development
Journal. This is an Open Access article
distributed
under
the terms of the
Creative Commons
Attribution License (CC BY 4.0)
(http://creativecommons.org/licenses/
by/4.0)
KEYWORDS: EMG, Fatigue, Endurance, Gastrocnemius muscle, Amplitude
parameters, Mean, Force, Standard deviation
I.
INTRODUCTION
Electromyography is a seductive muse because it provides
easy access to physiological processes that cause the
muscle to generate force produce movement and
accomplish the countless functions which allow us to
interact with the world around us. Clinical
electromyography (EMG) is the name applied to the
investigation of the electrical activity of normal and
diseased skeletal muscle of extracellular electrodes. EMG
is sometimes referred to as myoelectric activity. It
provides important information on the physiological
status of skeletal muscle and its nerve supply. It is more of
a qualitative than quantitative measure because it detects
the difference in potential between two points along a
muscle rather than single voltage. [1]
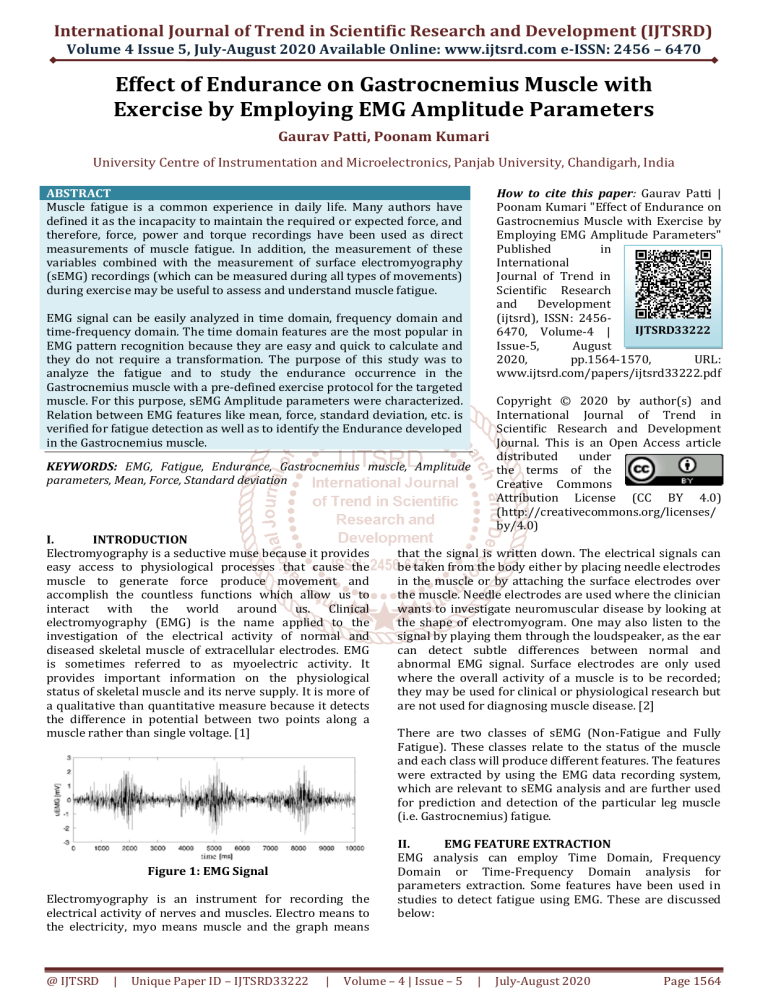
Figure 1: EMG Signal
Electromyography is an instrument for recording the
electrical activity of nerves and muscles. Electro means to
the electricity, myo means muscle and the graph means
@ IJTSRD
|
Unique Paper ID – IJTSRD33222
|
that the signal is written down. The electrical signals can
be taken from the body either by placing needle electrodes
in the muscle or by attaching the surface electrodes over
the muscle. Needle electrodes are used where the clinician
wants to investigate neuromuscular disease by looking at
the shape of electromyogram. One may also listen to the
signal by playing them through the loudspeaker, as the ear
can detect subtle differences between normal and
abnormal EMG signal. Surface electrodes are only used
where the overall activity of a muscle is to be recorded;
they may be used for clinical or physiological research but
are not used for diagnosing muscle disease. [2]
There are two classes of sEMG (Non-Fatigue and Fully
Fatigue). These classes relate to the status of the muscle
and each class will produce different features. The features
were extracted by using the EMG data recording system,
which are relevant to sEMG analysis and are further used
for prediction and detection of the particular leg muscle
(i.e. Gastrocnemius) fatigue.
II.
EMG FEATURE EXTRACTION
EMG analysis can employ Time Domain, Frequency
Domain or Time-Frequency Domain analysis for
parameters extraction. Some features have been used in
studies to detect fatigue using EMG. These are discussed
below:
Volume – 4 | Issue – 5
|
July-August 2020
Page 1564
International Journal of Trend in Scientific Research and Development (IJTSRD) @ www.ijtsrd.com eISSN: 2456-6470
1. Mean Absolute Value
Mean Absolute Value (MAV) is similar to average rectified
value (ARV). It can be calculated using the moving average
of full-wave rectified EMG. In other words, it is calculated
by taking the average of the absolute value of sEMG signal.
It is an easy way for detection of muscle contraction levels
and it is a popular feature used in myoelectric control
application.[3] It is defined as
2. Median Frequency
MDF is a frequency value at which the EMG power
spectrum is divided into two regions with an equal
integrated power. [4] It is calculated by
where Pj is the EMG power spectrum at a frequency bin j
and M is the length of frequency bin. Power spectra
density 𝑃 was calculated by the method of Periodogram
Welch.
3. Standard Deviation
It is defined as the standard deviation is a measure of the
amount of variation or dispersion of a set of values. A low
standard deviation indicates that the values tend to be
close to the mean of the set, while a high standard
deviation indicates that the values are spread out over a
wider range. The standard deviation is given by:
where 𝑥̅ is the mean value.
4. Force
Muscular force is the force applied using parts of the body
like arms or legs. It is force that results due to the action of
muscles, and is a contact force, since there is a contact
between the surfaces. In our project, dynamometer is used
for measuring the maximum isometric strength and force
of the leg. [5]
Endurance
We always come across a fact that as one gets sore
muscles after physical activity, known as delayed onset
muscle soreness (DOMS), can occur when you start a new
exercise program, change your exercise routine, or
increase the duration or intensity of your regular workout.
When muscles are required to work harder than they're
used to or in a different way, it's believed to cause
microscopic damage to the muscle fibres, resulting in
muscle soreness or stiffness. Anyone can develop DOMS,
even those who have been exercising for years, including
elite athletes. The good news is that the soreness will
decrease as your muscles get used to the new physical
demands being placed upon them. The soreness is part of
an adaptation process that leads to greater stamina and
strength as the muscles recover and build. DOMS typically
lasts between 3 and 5 days. [6]
Literature Review
The following papers were studied and analyzed in detail and hence summarized in the below table:
Table 1: Papers Reviewed
Topic of Paper
1. The
Effect
of
Endurance Exercise on
Muscle
Force
Generating Capacity of
the Lower Limbs [7]
2. Muscle
Fatigue
Analysis for Healthy
Adults Using TVAR
Model
with
Instantaneous
Frequency Estimation
[8]
Features Analyzed
Tools Used
Maximal isokinetic
torque, Mean +/Standard deviation, Force
generating capacity
Instantaneous frequency
and Mean frequency
estimation
Application
Six-second cycle test,
Isokinetic test, Concentric
squat jump
To investigate the recovery of
muscle force generating
capacity (FGC) of the lower
limbs following a session of
cycle exercise (CE).
Short time Fourier
Transform, Time varying
auto regressive method
This study confirms
that TVAR can be a better tool
for analyzing the level of
Muscle fatigue which further
leads to better performance in
sports personnel.
3. The Use of Surface
Electromyography in
Biomechanics [9]
Fatigue index, Motor unit
firing rate, Amplitude,
duration, and shape of the
MUAPs
Spectral modification, Cross
correlation, signal scaling
Three groups of applications
are considered: those
involving the activation timing
of muscles, the force/EMG
signal relationship, and the use
of the EMG signal as a fatigue
index.
4. A Surface EMG based
muscle
fatigue
evaluation
in
biomechanics [10]
Muscle fibre conduction
velocity (CV), median
frequency (MDF), RMS
value
Zero-crossing rate (ZCR),
Spike analysis, Fourierbased spectral estimators,
Joint analysis of EMG
spectrum and amplitude
(JASA)
This paper aims to present a
state of art in the area of local
muscle fatigue evaluation in
biomechanics by using sEMG
information.
@ IJTSRD
|
Unique Paper ID – IJTSRD33222
|
Volume – 4 | Issue – 5
|
July-August 2020
Page 1565
International Journal of Trend in Scientific Research and Development (IJTSRD) @ www.ijtsrd.com eISSN: 2456-6470
5. Surface EMG signal
processing
during
isometric contractions
[11]
Amplitude variables,
spectral variables and
muscle fiber conduction
velocity
Signal scaling, spectral
compression approach,
Fourier Transform, Choi–
Williams transform
Modeling approach may
indeed be useful for the noninvasive characterization of
superficial muscles and of
their motor units and
interpretation of the different
rate of change of spectral
variables.
III.
METHODS AND MATERIAL
Firstly, raw sEMG signal data of Gastrocnemius muscle was recorded using EMG system recorder. Secondly, the acquired
signal was analyzed for determination of various sEMG Amplitude parameters.
Figure 2: EMG and Fatigue recording setup
The Gastrocnemius Muscle
Gastrocnemius forms the major bulk at the back of lower leg and is a very powerful muscle. It is a two joint or biarticular
muscle and has two heads and runs from back of knee to the heel. When running, walking or jumping the gastrocnemius
provides a significant amount of propulsive force. Consider the amount of force required to propel the body into the air,
triceps surae can generate a lot of force.
Figure 3: The Gastrocnemius Muscle
The sEMG of 11 healthy male adults (age 25±02 years) was recorded for 10 days with one-day break. The eleven
participants were willing to reach physical fatigue state but not psychological one. They all were healthy and free from any
pain and disease during previous year. Another thing volunteers had moderate (non-extreme) level of self-reported daily
physical activity.
After being fully informed of the nature of the experiment, they signed an informed consent. First normal EMG, before
starting the exercise protocol, was recorded for all of them. Then they performed the exercise and again EMG was
recorded. Exercise included the three sets of calf muscle exercise as depicted in Figure 4 below.
Figure 4: Exercise Protocol
@ IJTSRD
|
Unique Paper ID – IJTSRD33222
|
Volume – 4 | Issue – 5
|
July-August 2020
Page 1566
International Journal of Trend in Scientific Research and Development (IJTSRD) @ www.ijtsrd.com eISSN: 2456-6470
The steps involved are as follows:
1. The maximum isometric strength and force of the leg were measured using a Dynamometer.
2. Goniometer was placed on the right side of the leg muscle to measure the ankle angle w.r.t ground floor.
3. The hair were completely removed from the location where the EMG electrodes were to be placed and the skin was
cleaned with ciprit in order to eliminate any wetness or sweat on the skin.
4. sEMG electrodes were placed on the participant’s calves muscle to acquire sEMG readings.
5. The participants were asked to do calves exercise consisting of total three sets with a rest of 30 seconds between each
set.
6. The participants were stopped when they reach fully fatigue stage and the data was recorded using the EMG data
recording system.
7. The same task was repeated for 10 days.
Based on the obtained readings, the sEMG Amplitude parameters were extracted to predict the fatigue so as to obtain the
desired results.
IV.
RESULTS AND DISCUSSION
The purpose of this study was to analyze the fatigue and to study the endurance occurrence in the Gastrocnemius muscle
with a pre-defined exercise protocol for the targeted muscle. For this purpose, sEMG Amplitude parameters were
characterized.
A. Mean and Force
Table 2: Parameters values of Pre-Exercise Protocol Day
Subject
Day
Force Mean ± Standard Deviation Median Value
Subject 1 Normal 26.5
619.31 ± 1.189
619
Subject 2 Normal
10
618.70 ± 2.227
619
Subject 3 Normal
8
618.24 ± 1.486
618
Subject 4 Normal 11.5
620.31 ± 1.489
620
Subject 5 Normal
7
620.49 ± 1.358
621
Subject 6 Normal
18
619.31 ± 1.795
620
Subject 7 Normal
9.5
618.53 ± 1.812
619
Subject 8 Normal
12
618.09 ± 1.29
618
Subject 9 Normal
32
619.24 ± 1.214
619
Subject 10 Normal
19
619.07 ± 1.467
619
Subject 11 Normal
12
618.68 ± 1.356
619
Table 3: Parameters values of the Max Fatigue Day
Subject
Day Force Mean ± Standard Deviation Median Value
Subject 1
2nd
28
618.50 ± 1.464
619
Subject 2
7th
8
617.76 ± 1.672
618
Subject 3
1st
8
618.06 ± 1.659
618
Subject 4
2nd
12.5
618.92 ± 1.584
619
th
Subject 5
4
9.5
618.49 ± 1.51
619
Subject 6
3rd
21
618.07 ± 1.292
618
Subject 7
3rd
8.5
617.86 ± 1.966
618
Subject 8
1st
12
617.82 ± 1.776
618
Subject 9
4th
20.5
617.84 ± 1.143
618
Subject 10 2nd
13
618.11 ± 1.539
618
Subject 11 3rd
5
617.91 ± 1.463
618
Table 2 and Table 3 shows the Pre exercise protocol (Normal muscle) and Post Exercise EMG Parameter calculations
respectively for all the subjects who underwent the experiment. Figure 5(a) & Figure 5(b) below shows the mean graph of
the all the subjects for maximum fatigue after exercise.
Figure 5(a): Mean variation with exercise
@ IJTSRD
|
Unique Paper ID – IJTSRD33222
|
Volume – 4 | Issue – 5
|
July-August 2020
Page 1567
International Journal of Trend in Scientific Research and Development (IJTSRD) @ www.ijtsrd.com eISSN: 2456-6470
Figure 5(b): Mean variation with exercise
It is clearly seen that muscles went under fatigue 2nd to 4thday post protocol start. Mean frequency of the EMG shows
decrease of value with increase of fatigue. This decrease of mean frequency is due to more recruitment of muscle fibers as
main muscles can no longer maintain the same force or power to do the required exercise as they have already
encountered a healthy wear and tear due to daily exercise protocol imposed to muscles. Experiencing of fatigue to muscles
is a result of the physical activities (i.e. exercise protocol) done by the subjects.
But on which day subject experience maximum fatigue is completely dependent upon the type of physical work done by
the subjects. Table 4 below depicts those categories.
No Exercise or
Sedentary Life Style
Subject 2
Subject 4
Subject 5
Subject 6
Subject 7
Subject 9
Subject 11
-----
Table 4: Activity Level of Participants
Regular Exercise or
BMI (kg/m2) Max Fatigue Experienced
Active Life Style
-25.3
7th Day
-34.6
2nd Day
-32.3
4th Day
-23
3rd Day
-23.5
3rd Day
-22
4th Day
-21.9
3rd Day
Subject 1
25.3
2nd Day
Subject 3
23.8
1st Day
Subject 8
22.1
1st Day
Subject 10
24.3
2nd Day
B. The relationship between EMG input and Force
output
It is also observed that subjects who were regular in doing
exercise showed negligible variation of force with exercise
protocol i.e. Subject 1 in Figure 6(a) and Subject 6 and
Subject 7 in Figure 6(b) respectively. Whereas Subject 2,
Subject 3, Subject 3 and Subject 5 have shown a constant
force adoption with time in general after 3rd or 4th day.
There is a rise in force produced in muscle, this is due to
the endurance developed.
Force
To maintain the required muscle activity for the workout (muscle force), MUs with higher firing rate of their amplitude
potential trains are recruited and the firing rates of initial MUAP trains increase. These increase of mean amplitude and
firing rate, leads to increase of total RMS.
Subject 1
Subject 2
Subject 3
Subject 4
35
30
25
20
15
10
5
0
0
1
2
3
4
5
6
7
8
9 10 11
Day
Figure 6(a): Plot of Force variation with exercise
@ IJTSRD
|
Unique Paper ID – IJTSRD33222
|
Volume – 4 | Issue – 5
|
July-August 2020
Page 1568
International Journal of Trend in Scientific Research and Development (IJTSRD) @ www.ijtsrd.com eISSN: 2456-6470
Subject 5
Subject 6
Subject 7
Subject 8
variable with reference to the value of independent
variable. [12]
A linearly increasing relationship is observed between
mean and force values calculated from EMG signal. Plot
shown in Figure 7 represents the R2as 0.757 whereas R2
ranges from 0.4821 to 0.8714. In which values lower than
0.7 are irrelevant whereas 0.7-0.99 are most significant.
25
Force
20
15
10
5
0
0
1
2
3
4
5
6
7
8
9 10 11
Day
Figure 6(b): Plot of Force variation with exercise
Subject 4
Max Fatigue Day
630
625
620
615
610
605
1
11
21
31
41
51
61
71
81
91
101
111
121
131
141
Amplitude
Normal Day
No. of cycles
Figure 7: EMG Plot of Subject 4
EMG plot shown in Figure 7 represents that EMG
amplitude also decreases with increase in fatigue of
muscles. In Figure 7 two EMG signal graphs are plotted,
one for non-fatigued muscle and another showing muscle
fatigue before recovery of the fatigue in muscle. This is
also verified with the mean variation.
C. Mean versus Force Plot
623
622
621
620
619
618
617
616
28.5
28.5
29
29.5
30.5
29.5
28
28.5
29
y = 0.3928x + 618.26
R² = 0.757
26.5
Mean
Subject 1
Force
Figure 8: Mean versus Force Graph
The mean versus force graphis plotted as shown in Figure
8 and it is observed that there is a positive linear
relationship between the plotted mean and its respective
force values. The correlation between variables indicates
that as one variable changes in value, the other variable
tends to change in a specific direction. The regression
analysis mathematically describes the relationship
between mean and force values. Also, this described linear
relationship may be used to predict the value of dependent
@ IJTSRD
|
Unique Paper ID – IJTSRD33222
|
D. Endurance
We also observed that muscles develop endurance after
encountering fatigue on 3rd to 4th day. Endurance
development is dependent upon the day to day activities
taken up by the subjects under study.[13] Table 5is
showing a comparison in the different muscles (Soleus and
Gastrocnemius muscles) of same subjects who underwent
the same exercise protocol for 10 days. Both readings
were recorded simultaneously after exercise on each day.
It is observed that
Both muscles had developed the fatigue on different
days. This definitely is the result of contribution of
muscles in activity to be performed.
Soleus muscle is to provide increase in angle between
foot and leg whereas Gastrocnemius muscle helps
Soleus muscle to work and provides flexing the leg at
the knee joint.
As Soleus muscle are always in the use while moving
ankles,hence they resulted in late fatigue in muscles.
At the same time Gastrocnemius which supported the
calf and knee got fatigued comparatively sooner.
Subjects having an active lifestyle develops muscle
endurance sooner than the subjects having a
sedentary lifestyle. [14] [15]
It was also observed that decreased values of force, mean
frequency and amplitude in sEMG (which occurred in
muscles due to fatigue) subsequently approaches back to
their initial values as observed prior to exercise protocol
as they develop endurance.
Table 5: Parameter values of Maximum Fatigue Day
Soleus [14]
Gastrocnemius
Subject Day Force Mean Day
Force
Mean
Subject
3rd 28.5 619.06 2nd
28
618.50
1
Subject
8th
8 617.76 7th
8
617.76
2
Subject
5th 8.5 618.82 1st
8
618.06
3
Subject
3rd
13 618.92 2nd
12.5
618.92
4
Subject
5th 9.5 618.68 4th
9.5
618.49
5
Subject
3rd
21 618.00 3rd
21
618.07
6
Subject
3rd 8.5 617.87 3rd
8.5
617.86
7
Subject
6th 16.5 618.04 1st
12
617.82
8
V.
CONCLUSION
Presented work is giving us the ways to identify muscle
fatigue developed due to known workout and quantifies
the effect of endurance in the muscle with fatigue on
Gastrocnemius muscles. It is observed that introduction of
Volume – 4 | Issue – 5
|
July-August 2020
Page 1569
International Journal of Trend in Scientific Research and Development (IJTSRD) @ www.ijtsrd.com eISSN: 2456-6470
fatigue results in decrease of force (F) as well as decrease
of mean frequency (MF) and amplitude (Amp) in the
sEMG. It has been observed that there is linear relation
between MF and F. Its further observed that endurance
plays a major role when one goes take-up some physical
activity or exercise. Its documented also that fatigue
affects the muscular activities but due to endurance (that
is definitely dependent upon the life style of the subject) of
muscle fatigue dies out and muscle resumes its full activity
in 5-10 days.
All the subjects were introduced to an anaerobic exercise
protocol and later measurements were done. There are
inordinate chances that aerobic exercise protocol may
result in completely different level of endurance and hence
the muscle force producing capacity rejuvenation after
exercise.
REFERENCES
[1] Peter Konrad, “The ABC of EMG, A Practical
Introduction to Kinesiological Electromyography”,
Version 1.0 April 2005.
[2] M. B. I. Reaz, M. S. Hussain and F. Mohd-Yasin,
“Techniques of EMG signal analysis: detection,
processing,
classification
and
applications”,
BiolProced Online, pp.11-35, vol. 8 23 Mar 2006, doi:
10.1251/bpo115
[3] Kosha Patel, “A Review on Feature Extraction
Methods”, PG Student, Dept. of Biomedical
Engineering, Government Engineering College,
Gandhinagar, Gujarat, India.
[4] Liu Cao, Ying Wang, DongmeiHao, Lin Yang, “Effects
of Force Load, Muscle Fatigue, and Magnetic
Stimulation on Surface Electromyography during
Side Arm Lateral Raise Task: A Preliminary Study
with
Healthy
Subjects,”
BioMed
Research
International, vol. 2017, pp. 1-9, march 2017.
[5] health.uottawa.ca Archived 2009-11-16 at the
Wayback Machine, Dynamometry.
@ IJTSRD
|
Unique Paper ID – IJTSRD33222
|
[6] E-article “Why do I feel pain after exercise?” accessed
https://www.nhs.uk/live-well/exercise/pain-afterexercise/ dated 7/8/2020.
[7] David J. Bentley, Shi Zhou & Allan J. Davie, “The Effect
of Endurance Exercise on Muscle Force Generating
Capacity of the Lower Limbs”.
[8] Abdullah Al zaman, Mohammed Ferdjallah Ph.D., and
Ahmed Khamayesh Ph.D., “Muscle Fatigue Analysis
for Healthy Adults Using TVAR Model with
Instantaneous Frequency Estimation”.
[9] Carlo J. De Luca, “The Use of Surface
Electromyography in Biomechanics”, [Wartenweiler
Memorial lecture (The International Society for
Biomechanics) 5 July 1993], Neuromuscular
Research Centre, Boston University.
[10] Mario Cifrek, Vladimir Medved, StankoTonkovic,
SašaOstojic, “A Surface EMG based muscle fatigue
evaluation in biomechanics”.
[11] Roberto Merletti, “Surface EMG signal processing
during isometric contractions”.
[12] Jim Frost, “Regression Analysis, an intuitive guide for
using and interpreting linear models”.
[13] David J. Bentley, Shi Zhou & Allan J. Davie, “The Effect
of Endurance Exercise on Muscle Force Generating
Capacity of the Lower Limbs”.
[14] Rohit, Poonam Kumari, “Fatigue Detection in Soleus
muscle by characterizing its Electro-Myogram”,
International Journal for Science and Advance
Research in Technology (IJSART); Vol-6, Issue-1,
January 2020.
[15] Sunil Kumar, Poonam Kumari, “Quantitative
Assessment of Forearm Muscle Fatigue with
Repetitive Task”, International Journal for Research
in Applied Science & Engineering Technology
(IJRASET); Vol-8, Issue-7, July 2020.
Volume – 4 | Issue – 5
|
July-August 2020
Page 1570

