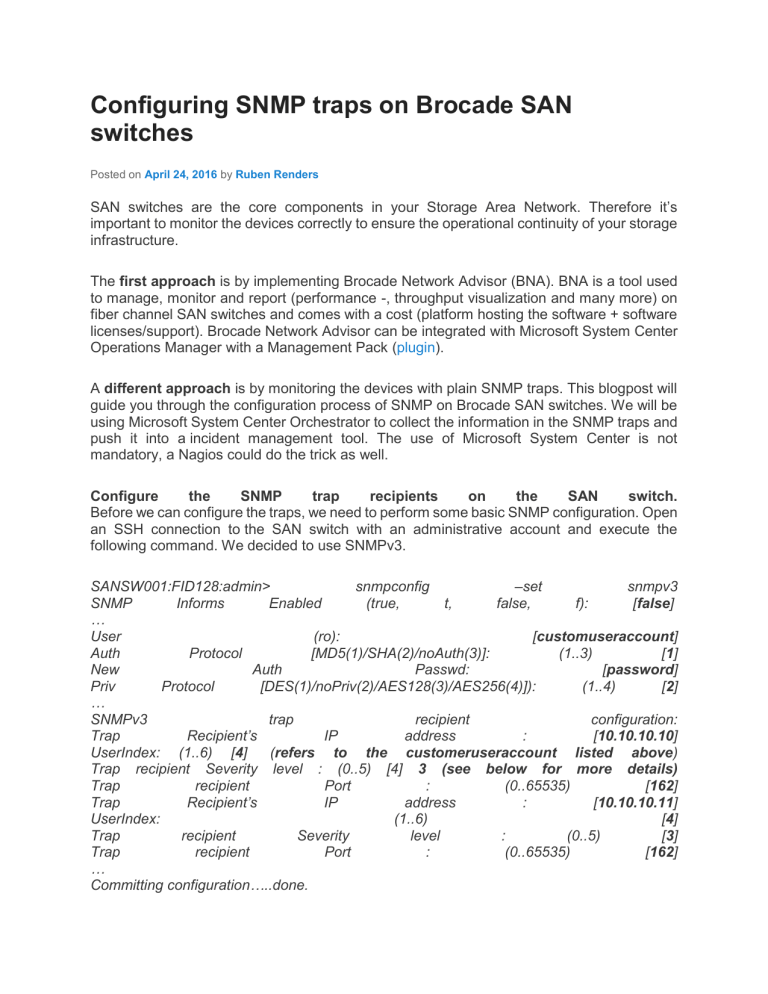
Configuring SNMP traps on Brocade SAN switches Posted on April 24, 2016 by Ruben Renders SAN switches are the core components in your Storage Area Network. Therefore it’s important to monitor the devices correctly to ensure the operational continuity of your storage infrastructure. The first approach is by implementing Brocade Network Advisor (BNA). BNA is a tool used to manage, monitor and report (performance -, throughput visualization and many more) on fiber channel SAN switches and comes with a cost (platform hosting the software + software licenses/support). Brocade Network Advisor can be integrated with Microsoft System Center Operations Manager with a Management Pack (plugin). A different approach is by monitoring the devices with plain SNMP traps. This blogpost will guide you through the configuration process of SNMP on Brocade SAN switches. We will be using Microsoft System Center Orchestrator to collect the information in the SNMP traps and push it into a incident management tool. The use of Microsoft System Center is not mandatory, a Nagios could do the trick as well. Configure the SNMP trap recipients on the SAN switch. Before we can configure the traps, we need to perform some basic SNMP configuration. Open an SSH connection to the SAN switch with an administrative account and execute the following command. We decided to use SNMPv3. SANSW001:FID128:admin> snmpconfig –set snmpv3 SNMP Informs Enabled (true, t, false, f): [false] … User (ro): [customuseraccount] Auth Protocol [MD5(1)/SHA(2)/noAuth(3)]: (1..3) [1] New Auth Passwd: [password] Priv Protocol [DES(1)/noPriv(2)/AES128(3)/AES256(4)]): (1..4) [2] … SNMPv3 trap recipient configuration: Trap Recipient’s IP address : [10.10.10.10] UserIndex: (1..6) [4] (refers to the customeruseraccount listed above) Trap recipient Severity level : (0..5) [4] 3 (see below for more details) Trap recipient Port : (0..65535) [162] Trap Recipient’s IP address : [10.10.10.11] UserIndex: (1..6) [4] Trap recipient Severity level : (0..5) [3] Trap recipient Port : (0..65535) [162] … Committing configuration…..done. Trap recipient severity can be one of the following values: [0] none, [1] critical, [2] error, [3] warning, [4] informational or [5] debug. When an event occurs and it’s severity level is equal or below the configured value, an SNMP trap is sent to the configured SNMP trap recipients. Define the SNMP traps you want to catch. The easiest way is to consult the “Fabric OS MIB Reference Guide” and list the traps you want to catch. We decided to catch only the traps: “swEventTrap” and “swStateChangeTrap“, where “swEventTrap” contains events added to the system error log and “swstatechangetrap” is triggered when the switch goes from “Online” to “Offline” or “Marginal”. These traps are not active by default, execute the following commands to activate them: SANSW001:FID128:admin> snmpconfig –set mibcapability -mib_name SW-MIB -bitmask 1 SANSW001:FID128:admin> snmpconfig –enable mibcapability -mib_name SW-MIB trap_name swEventTrap SANSW001:FID128:admin> snmpconfig –enable mibcapability -mib_name SW-MIB trap_name swStateChangeTrap Reconfigure the switch status policy to correctly send events upon port changes (faultyand/or marginal ports). You need to change this carefully, as we don’t want an incident to be created upon a server reboot. In the SSH session, execute the following commands and configure the values according to the switch type and number of utilized ports. We don’t want to transition the switch into a “Down” status because too many ports are faulty or down, we do want to change the status to “Marginal” as this will trigger both the “swEventTrap” (bad port is listed in the event log) and “swStateChangeTrap” as the switch transitioned into a “Marginal” status. SANSW001:FID128:admin> switchstatuspolicyset To change the overall switch status policy parameters the current overall switch status policy parameters: … The minimum number of Bad PowerSupplies contributing to DOWN status: (0..2) [2] Bad PowerSupplies contributing to MARGINAL status: (0..2) [1] Bad Temperatures contributing to DOWN status: (0..1) [1] Bad Temperatures contributing to MARGINAL status: (0..1) [1] Bad Fans contributing to DOWN status: (0..2) [2] Bad Fans contributing to MARGINAL status: (0..2) [1] Out of range Flash contributing to DOWN status: (0..1) [0] Out of range Flash contributing to MARGINAL status: (0..1) [1] MarginalPorts contributing to DOWN status: (0..100) [25.00] MarginalPorts contributing to MARGINAL status: (0..100) [10.00] 1 FaultyPorts contributing to DOWN status: (0..100) [25.00] FaultyPorts contributing to MARGINAL status: (0..100) [10.00] 1 MissingSFPs contributing to DOWN status: (0..100) [0.00] MissingSFPs contributing to MARGINAL status: (0..100) [0.00] ErrorPorts contributing to DOWN status: (0..100) [0.00] ErrorPorts contributing to MARGINAL status: (0..100) [0.00] Policy parameter set has been changed Remark: I have to admit we need to validate this setup with NPIV ports. An NPIV port does not immediately correlate with a physical port, hence the port status will be unchanged. The creation of an SNMP trap is purely based on an event in the system eveng log. This requires a more detailed validation! Finally, we can send out a test trap to validate if the monitoring tool successfully catches the trap and pushes it into the Incident Management platform. A test trap can be sent from the SSH session by using the following command: SANSW001:FID128:admin> snmptraps –send -trap_name sw-event-trap -ipaddress 10.10.10.10 Number of traps sent : 1 You successfully configured basic monitoring on a HPE SN6000B Brocade SAN switch. You can go a little bit further in the setup by allowing Microsoft System Center to collect the throughput/performance details. Statistics can be collected by using the “Bottleneck Detection (BD) MIB objects“. As this setup is for a rather small environment, we decided to use basic monitoring only.


