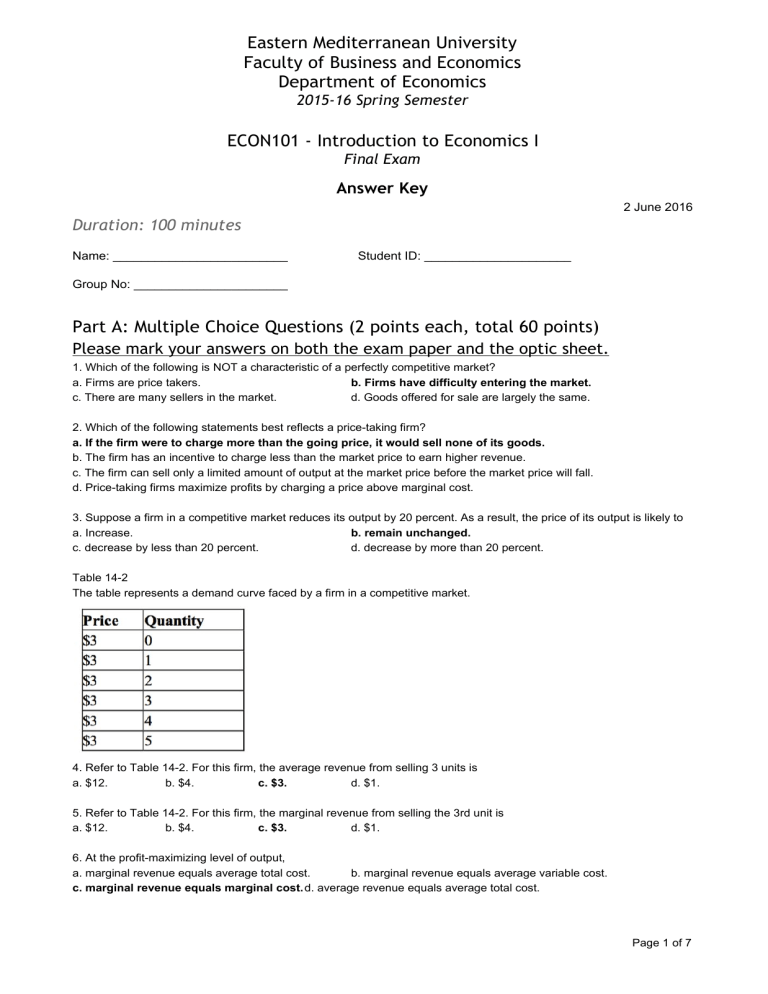
Eastern Mediterranean University Faculty of Business and Economics Department of Economics 2015‐16 Spring Semester ECON101 ‐ Introduction to Economics I Final Exam Answer Key 2 June 2016 Duration: 100 minutes Name: _________________________ Student ID: _____________________ Group No: ______________________ Part A: Multiple Choice Questions (2 points each, total 60 points) Please mark your answers on both the exam paper and the optic sheet. 1. Which of the following is NOT a characteristic of a perfectly competitive market? a. Firms are price takers. b. Firms have difficulty entering the market. c. There are many sellers in the market. d. Goods offered for sale are largely the same. 2. Which of the following statements best reflects a price­taking firm? a. If the firm were to charge more than the going price, it would sell none of its goods. b. The firm has an incentive to charge less than the market price to earn higher revenue. c. The firm can sell only a limited amount of output at the market price before the market price will fall. d. Price­taking firms maximize profits by charging a price above marginal cost. 3. Suppose a firm in a competitive market reduces its output by 20 percent. As a result, the price of its output is likely to a. Increase. b. remain unchanged. c. decrease by less than 20 percent. d. decrease by more than 20 percent. Table 14­2 The table represents a demand curve faced by a firm in a competitive market. 4. Refer to Table 14­2. For this firm, the average revenue from selling 3 units is a. $12. b. $4. c. $3. d. $1. 5. Refer to Table 14­2. For this firm, the marginal revenue from selling the 3rd unit is a. $12. b. $4. c. $3. d. $1. 6. At the profit­maximizing level of output, a. marginal revenue equals average total cost. b. marginal revenue equals average variable cost. c. marginal revenue equals marginal cost. d. average revenue equals average total cost. Page 1 of 7 Figure 14­2 Suppose a firm operating in a competitive market has the following cost curves: 7. Refer to Figure 14­2. If the market price is Pa, in the short run the firm will earn a. positive economic profits. b. negative economic profits but will try to remain open. c. negative economic profits and will shut down. d. zero economic profits. 8. Refer to Figure 14­2. If the market price is Pb, in the short run the firm will earn a. positive economic profits. b. negative economic profits but will try to remain open. c. negative economic profits and will shut down. d. zero economic profits. 9. Refer to Figure 14­2. If the market price is Pc, in the short run the firm will earn a. positive economic profits. b. negative economic profits but will try to remain open. c. negative economic profits and will shut down. d. zero economic profits. 10. Refer to Figure 14­2. If the market price is Pd, in the short run the firm will earn a. positive economic profits. b. negative economic profits but will try to remain open. c. negative economic profits and will shut down. d. zero economic profits. 11. Which of the following would be most likely to have monopoly power? a. an online bookstore b. a municipal water company c. a local restaurant d. a grocery store 12. A fundamental source of monopoly market power arises from a. perfectly elastic demand. b. perfectly inelastic demand. c. barriers to entry. d. availability of "free" natural resources, such as water or air. 13. The defining characteristic of a natural monopoly is a. constant marginal cost over the relevant range of output. b. economies of scale over the relevant range of output. c. constant returns to scale over the relevant range of output. d. diseconomies of scale over the relevant range of output. 14. For a monopoly firm, a. price always exceeds average revenue. c. any price­quantity combination will maximize profits. b. price always exceeds marginal revenue. d. All of the above are correct. Page 2 of 7 15. Refer to Figure 14­8. Which line segment Figure 14­8 best reflects the short­run supply curve for this Suppose a firm operating in a competitive market has the firm? following cost curves: a. ABCF b. CF c. DF d. BCD 16. Which of the following statements is correct? a. The demand curve facing a competitive firm is horizontal, as is the demand curve facing a monopolist. b. The demand curve facing a competitive firm is downward sloping, whereas the demand curve facing a monopolist is horizontal. c. The demand curve facing a competitive firm is horizontal, whereas the demand curve facing a monopolist is downward sloping. d. The demand curve facing a competitive firm is downward sloping, as is the demand curve facing a monopolist. 17. The price elasticity of demand measures how much a. quantity demanded responds to a change in price. b. quantity demanded responds to a change in income. c. price responds to a change in demand. d. demand responds to a change in supply. 18. The smaller the price elasticity of demand, the a. more likely the product is a luxury. b. smaller the responsiveness of quantity demanded to a change in price. c. more substitutes the product has. d. greater the responsiveness of quantity demanded to a change in price. 19. If the price elasticity of supply for a good is equal to infinity, then the a. supply curve is vertical. b. supply curve is horizontal. c. supply curve also has a slope equal to infinity. d. quantity supplied is constant regardless of the price. 20. A difference between explicit and implicit costs is that a. explicit costs must be greater than implicit costs. b. explicit costs do not require a direct monetary outlay by the firm, whereas implicit costs do. c. implicit costs do not require a direct monetary outlay by the firm, whereas explicit costs do. d. implicit costs must be greater than explicit costs. Page 3 of 7 21. Refer to Figure 15­5. A profit­maximizing monopoly will produce an output level of a. Q1. b. Q2. c. Q3. d. Q4. 22. Refer to Figure 15­5. A profit­maximizing monopoly will charge a price of a. P1. b. P2. c. P3. d. P4. 23. Refer to Figure 15­5. A profit­maximizing monopoly's total revenue is equal to a. P1 x Q1. b. P2 x Q3. c. P3 x Q4. d. (P2­P4) x Q3. 24. Refer to Figure 15­5. A profit­maximizing monopoly's total cost is equal to a. P2 x Q3. b. P4 x Q3. c. P5 x Q3. d. (P2­P5) x Q3. 25. Refer to Figure 15­5. A profit­maximizing monopoly's profit is equal to a. P2 x Q3. b. (P2­P4) x Q3. c. (P2­P5) x Q3. d. (P1­P6) x Q1. 26. Economists assume that the goal of the firm is to maximize total a. revenue. b. profits. c. costs. d. satisfaction. 27. Total cost is the a. amount a firm receives for the sale of its output. b. fixed cost less variable cost. c. market value of the inputs a firm uses in production. d. quantity of output minus the quantity of inputs used to make a good. 28. The theory of consumer choice examines a. the determination of output in competitive markets. b. the tradeoffs in decisions made by consumers. c. how consumers select inputs into manufacturing production processes. d. the determination of prices in competitive markets. 29. A budget constraint shows a. the maximum utility that a consumer can achieve for a given level of income. b. a series of bundles that cost the consumer the same amount of money. c. a series of bundles that give the consumer the same level of utility. d. All of the above are correct. 30. A consumer chooses an optimal consumption point where the a. marginal rate of substitution equals the relative price ratio. b. slope of the indifference curve exceeds the slope of the budget constraint. c. ratios of all the marginal utilities are equal. d. All of the above are correct. Page 4 of 7 Part B: Essay Questions (55 points) Question 1. Draw a long­run average total cost curve and also explain the concepts of economies of scale and diseconomies of scale with the help of the graph. (15 points) Answer: When long­run average total cost declines as output increases, there are said to be economies of scale. Economies of scale often arise because higher production levels allow specialization among workers, which permits each worker to become better at a specific task. When long­run average total cost rises as output increases, there are said to be diseconomies of scale. Diseconomies of scale can arise because of coordination problems that are inherent in any large organization. The more cars Ford produces, the more stretched the management team becomes, and the less effective the managers become at keeping costs down. Question 2. Suppose that a consumer has an income of $40, the price of a bag of biscuit is $2, and the price of a bag of chocolate is $2. (15 points) a. Draw the consumer’s budget constraint (the quantity of biscuit on the X­axis and the quantity of chocolate on the Y­axis). b. Assume that the consumer’s income increases to $100, show the change in consumer’s budget constraint on the same graph above, ceteris paribus. c. Suppose when the consumer’s income is $100, the price of biscuits increases to $5, draw the new budget constraint on the same graph above, ceteris paribus. Answer for all parts: Page 5 of 7 Question 3. The graph shows the cost structure of a monopolistic firm. Use the graph to answer the following questions. a. Calculate the economic profit/loss (indicate which one). Show it on the graph. (8 points) Answer: The monopolists maximises its profit by equating its MC to the MR. This point is shown on the graph as A. Therefore, the profit­maximising output is found to be 4 units per day. The monopolist will charge the price of 10 dollars per unit as shown as point B. The point C on the diagram shows the amount of ATC of producing 4 units per day. Given that the ATC is 8 (below the price), we find the monopolist’s profit as follows: (P ­ ATC)*Q = (10 ­ 8)*4 = $8 per day The profit is shown on the graph as the shaded rectangle. b. Calculate the deadweight loss from monopoly. Explain the concept of social cost created by the monopolist. (7 points) Answer: If there were a competitive market instead of a monopoly, the demand curve D would be the MR of the market (where individual firms’ MR curves would be a horizontal line being equal to the price level). The profit­maximising production point would be found by equating the demand curve to the MC curve, as labeled on the graph as D. In a competitive market, the profit­maximising output would be 6 units per day, and the price would be 6 per unit. As we have found in part A, the monopolist will use its market power in order to reduce the output (from 6 to 4) and raise the price (from 6 to 10). Therefore, the deadweight loss would be the area ABD. The amount of the loss is (10 ­ 2)*6/2 = $24 per day When the market is monopolized, there is an amount of surplus transferred from consumers to producers, which is not a social cost. However, the area ABD is the amount of surplus enjoyed neither by consumers nor by producers anymore. Therefore, that is considered as a social cost created by the monopolist. In other words, the problem in a monopolized market arises because the firm produces and sells a quantity of output below the level that maximizes total surplus. The deadweight loss measures how much the economic pie shrinks as a result. Page 6 of 7 Bonus Question. Fill in the following table. (10 points) Output TC TFC 0 60 60 10 110 20 TVC AFC AVC ATC SMC 0 ­ ­ ­ ­ 60 50 6 5 11 5 150 60 90 3 4.5 7.5 4 30 215 60 155 2 5.17 7.17 6.5 40 287 60 227 1.5 5.68 7.18 7.2 50 367 60 307 1.2 6.14 7.34 8 60 452 60 392 1 6.53 7.53 8.5 70 542 60 482 0.86 6.89 7.74 9 80 642 60 582 0.75 7.28 8.03 10 Page 7 of 7
