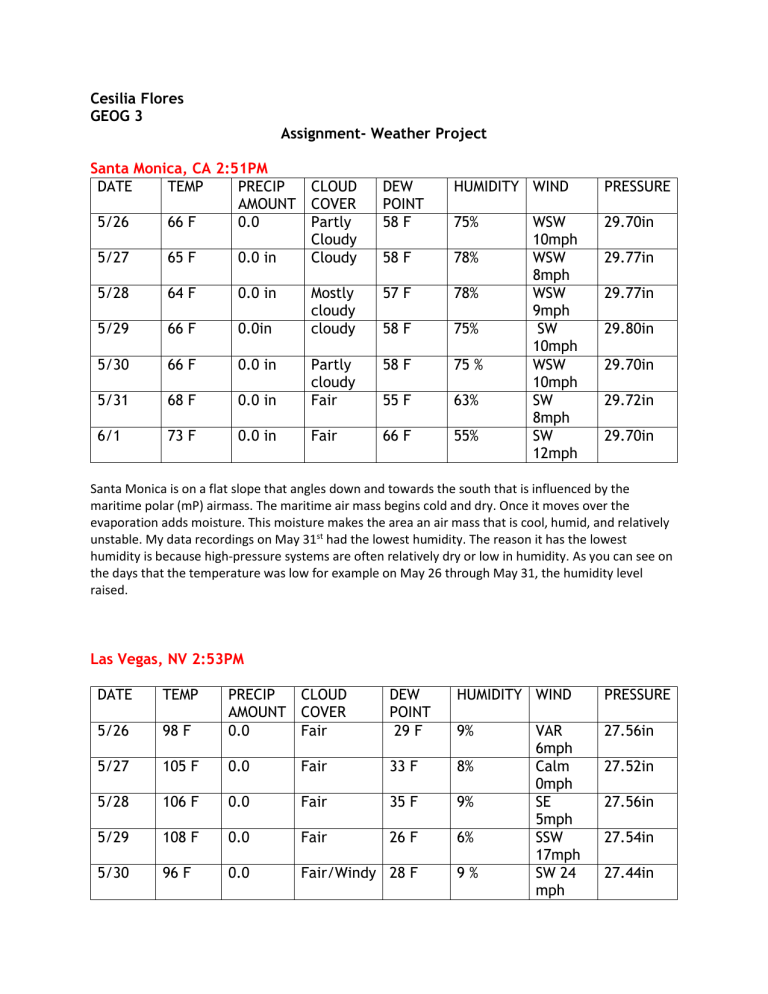
Cesilia Flores GEOG 3 Assignment- Weather Project Santa Monica, CA 2:51PM DATE TEMP PRECIP AMOUNT 5/26 66 F 0.0 CLOUD COVER Partly Cloudy Cloudy DEW POINT 58 F HUMIDITY WIND PRESSURE 75% 29.70in 58 F 78% Mostly cloudy cloudy 57 F 78% 58 F 75% 58 F 75 % 55 F 63% 66 F 55% 5/27 65 F 0.0 in 5/28 64 F 0.0 in 5/29 66 F 0.0in 5/30 66 F 0.0 in 5/31 68 F 0.0 in Partly cloudy Fair 6/1 73 F 0.0 in Fair WSW 10mph WSW 8mph WSW 9mph SW 10mph WSW 10mph SW 8mph SW 12mph 29.77in 29.77in 29.80in 29.70in 29.72in 29.70in Santa Monica is on a flat slope that angles down and towards the south that is influenced by the maritime polar (mP) airmass. The maritime air mass begins cold and dry. Once it moves over the evaporation adds moisture. This moisture makes the area an air mass that is cool, humid, and relatively unstable. My data recordings on May 31st had the lowest humidity. The reason it has the lowest humidity is because high-pressure systems are often relatively dry or low in humidity. As you can see on the days that the temperature was low for example on May 26 through May 31, the humidity level raised. Las Vegas, NV 2:53PM DATE TEMP DEW POINT 29 F HUMIDITY WIND PRESSURE 98 F PRECIP CLOUD AMOUNT COVER 0.0 Fair 5/26 9% 27.56in 5/27 105 F 0.0 Fair 33 F 8% 5/28 106 F 0.0 Fair 35 F 9% 5/29 108 F 0.0 Fair 26 F 6% 5/30 96 F 0.0 Fair/Windy 28 F 9% VAR 6mph Calm 0mph SE 5mph SSW 17mph SW 24 mph 27.52in 27.56in 27.54in 27.44in 5/31 98 F 0.0 Fair 28 F 8% 6/1 98 F 0.0 Fair 30 F 9% WSW 14 mph SSW 9mph 27.49in 27.56in Las Vegas is the driest and least humid locations in North America. As this shows in the temperature from the data collected. The high pressure along the west coast which is shown on the national weather maps provided the dry weather. Omaha, NE 2:52 PM DATE TEMP PRECIP CLOUD AMOUNT COVER 5/26 65 F 0.0 in cloudy DEW POINT 63 F HUMIDITY WIND PRESSURE 90% 28.72in 65 F 93% 53 F 39% 5/27 67 F 0.0in 5/28 80 F 0.0in 5/29 75 F 0.0in Light drizzle Mostly cloudy Fair 46 F 36% 5/30 5/31 59 F 76 F 0.0in 0.0 in Cloudy 55 F Fair/Windy 58 F 87% 54% 6/1 90 F 0.0 in Mostly Cloudy/ Windy 37% 60 F NNW 14mph NNW 8mph NNE 14mph NNW 16mph E 6mph SE 21mph SSW 25 mph 28.84in 28.94in 29.10in 29.21in 29.09in 28.82in Omaha is the largest city in the state of Nebraska. It displays a humid continental climate. The latitude and the location is far from water and mountain ranges which is why it displays a humid climate. On May 28, and June 1 the temperature had warmed up. This is due to the warm front. New York, NY 2:51PM DATE TEMP PRECIP AMOUNT 5/26 76 F 0.0 in 5/27 76 F 0.0 in 5/28 75 F 0.0 in 5/29 81 F 0.0 in CLOUD COVER Fair Mostly cloudy Mostly cloudy Mostly cloudy DEW POINT 59 F 62 F 66 F 65 F HUMIDITY WIND PRESSURE 56% 62% S 8mph 30.17in S 12mph 30.18in 73% S 30.10in 17mph S 17mph 29.92in 58% 5/30 80 F 0.0 in 5/31 70 F 0.0 in 6/1 69 F 0.0 in Partly Cloudy Fair 47 F 31% 33 F 26% Mostly Cloudy 34 F 27% NW 8mph NW 17mph WNW 15mph 29.84 in 30.01in 30.10in New York is stationed between the both low pressure and hi pressure zones. As shown in my data, they have a high pressure the whole week creating stationary fronts. This results in being able avoid precipitation all week. MAY 26, 2020 May 27, 2020 May 28, 2020 May 29, 2020 May 30,2020 May 31, 2020 June 1, 2020
