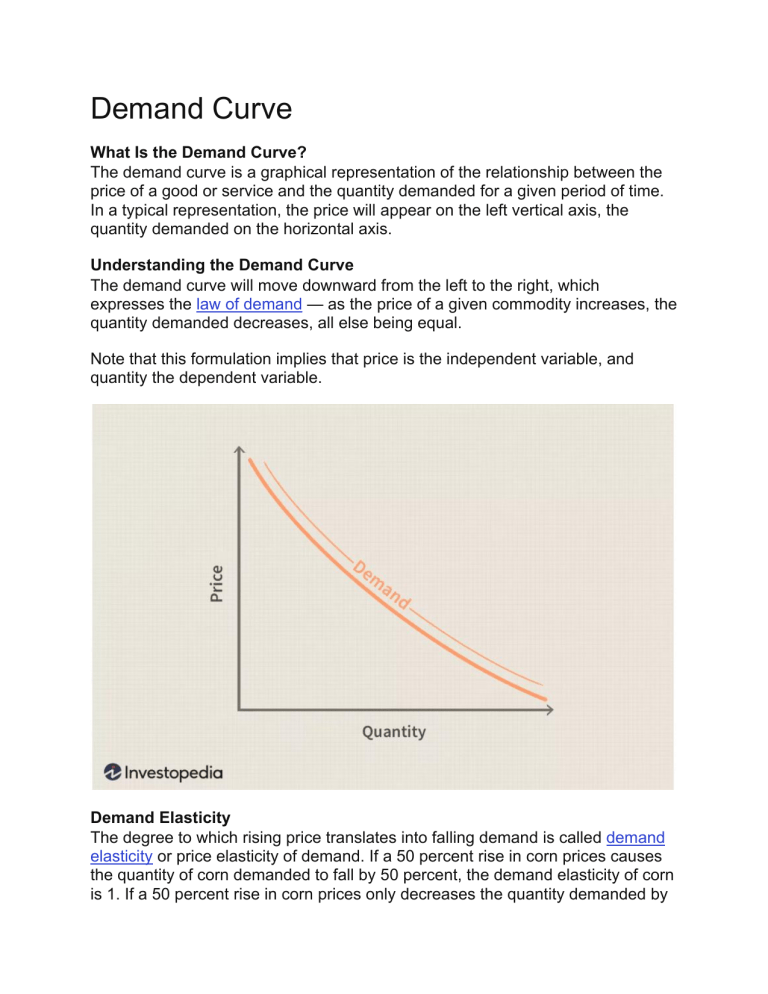
Demand Curve What Is the Demand Curve? The demand curve is a graphical representation of the relationship between the price of a good or service and the quantity demanded for a given period of time. In a typical representation, the price will appear on the left vertical axis, the quantity demanded on the horizontal axis. Understanding the Demand Curve The demand curve will move downward from the left to the right, which expresses the law of demand — as the price of a given commodity increases, the quantity demanded decreases, all else being equal. Note that this formulation implies that price is the independent variable, and quantity the dependent variable. Demand Elasticity The degree to which rising price translates into falling demand is called demand elasticity or price elasticity of demand. If a 50 percent rise in corn prices causes the quantity of corn demanded to fall by 50 percent, the demand elasticity of corn is 1. If a 50 percent rise in corn prices only decreases the quantity demanded by 10 percent, the demand elasticity is 0.2. The demand curve is shallower (closer to horizontal) for products with more elastic demand, and steeper (closer to vertical) for products with less elastic demand. If a factor besides price or quantity changes, a new demand curve needs to be drawn. For example, say that the population of an area explodes, increasing the number of mouths to feed. In this scenario, more corn will be demanded even if the price remains the same, meaning that the curve itself shifts to the right (D2) in the graph below. In other words, demand will increase. Other factors can shift the demand curve as well, such as a change in consumers' preferences. If cultural shifts cause the market to shun corn in favor of quinoa, the demand curve will shift to the left (D3). If consumers' income drops, decreasing their ability to buy corn, demand will shift left (D3). If the price of a substitute – from the consumer's perspective – increases, consumers will buy corn instead, and demand will shift right (D2). If the price of a complement, such as charcoal to grill corn, increases, demand will shift left (D3). If the future price of corn is higher than the current price, the demand will temporarily shift to the right (D2), since consumers have an incentive to buy now before the price rises.


