IRJET- Prediction of Cbr Value from Index Properties Of Soil
advertisement
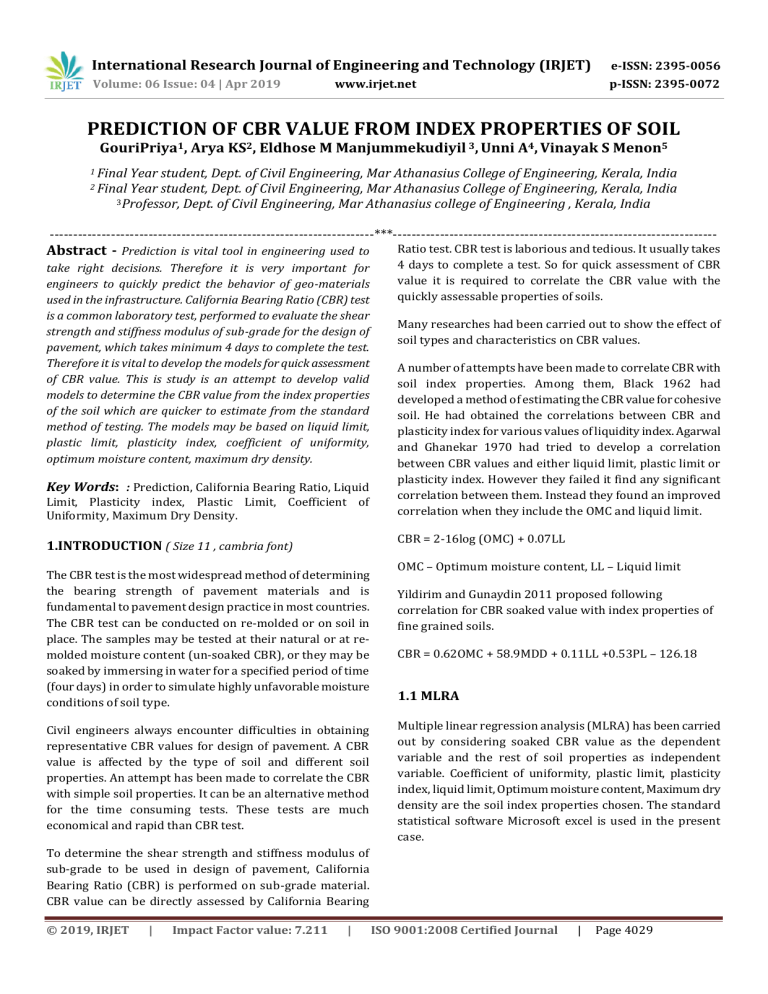
International Research Journal of Engineering and Technology (IRJET) e-ISSN: 2395-0056 Volume: 06 Issue: 04 | Apr 2019 p-ISSN: 2395-0072 www.irjet.net PREDICTION OF CBR VALUE FROM INDEX PROPERTIES OF SOIL GouriPriya1, Arya KS2, Eldhose M Manjummekudiyil 3, Unni A4, Vinayak S Menon5 1 Final Year student, Dept. of Civil Engineering, Mar Athanasius College of Engineering, Kerala, India Year student, Dept. of Civil Engineering, Mar Athanasius College of Engineering, Kerala, India 3Professor, Dept. of Civil Engineering, Mar Athanasius college of Engineering , Kerala, India 2 Final ---------------------------------------------------------------------***--------------------------------------------------------------------- Abstract - Prediction is vital tool in engineering used to take right decisions. Therefore it is very important for engineers to quickly predict the behavior of geo-materials used in the infrastructure. California Bearing Ratio (CBR) test is a common laboratory test, performed to evaluate the shear strength and stiffness modulus of sub-grade for the design of pavement, which takes minimum 4 days to complete the test. Therefore it is vital to develop the models for quick assessment of CBR value. This is study is an attempt to develop valid models to determine the CBR value from the index properties of the soil which are quicker to estimate from the standard method of testing. The models may be based on liquid limit, plastic limit, plasticity index, coefficient of uniformity, optimum moisture content, maximum dry density. Key Words: : Prediction, California Bearing Ratio, Liquid Limit, Plasticity index, Plastic Limit, Coefficient of Uniformity, Maximum Dry Density. Ratio test. CBR test is laborious and tedious. It usually takes 4 days to complete a test. So for quick assessment of CBR value it is required to correlate the CBR value with the quickly assessable properties of soils. Many researches had been carried out to show the effect of soil types and characteristics on CBR values. A number of attempts have been made to correlate CBR with soil index properties. Among them, Black 1962 had developed a method of estimating the CBR value for cohesive soil. He had obtained the correlations between CBR and plasticity index for various values of liquidity index. Agarwal and Ghanekar 1970 had tried to develop a correlation between CBR values and either liquid limit, plastic limit or plasticity index. However they failed it find any significant correlation between them. Instead they found an improved correlation when they include the OMC and liquid limit. CBR = 2-16log (OMC) + 0.07LL 1.INTRODUCTION ( Size 11 , cambria font) The CBR test is the most widespread method of determining the bearing strength of pavement materials and is fundamental to pavement design practice in most countries. The CBR test can be conducted on re-molded or on soil in place. The samples may be tested at their natural or at remolded moisture content (un-soaked CBR), or they may be soaked by immersing in water for a specified period of time (four days) in order to simulate highly unfavorable moisture conditions of soil type. Civil engineers always encounter difficulties in obtaining representative CBR values for design of pavement. A CBR value is affected by the type of soil and different soil properties. An attempt has been made to correlate the CBR with simple soil properties. It can be an alternative method for the time consuming tests. These tests are much economical and rapid than CBR test. OMC – Optimum moisture content, LL – Liquid limit Yildirim and Gunaydin 2011 proposed following correlation for CBR soaked value with index properties of fine grained soils. CBR = 0.62OMC + 58.9MDD + 0.11LL +0.53PL – 126.18 1.1 MLRA Multiple linear regression analysis (MLRA) has been carried out by considering soaked CBR value as the dependent variable and the rest of soil properties as independent variable. Coefficient of uniformity, plastic limit, plasticity index, liquid limit, Optimum moisture content, Maximum dry density are the soil index properties chosen. The standard statistical software Microsoft excel is used in the present case. To determine the shear strength and stiffness modulus of sub-grade to be used in design of pavement, California Bearing Ratio (CBR) is performed on sub-grade material. CBR value can be directly assessed by California Bearing © 2019, IRJET | Impact Factor value: 7.211 | ISO 9001:2008 Certified Journal | Page 4029 International Research Journal of Engineering and Technology (IRJET) e-ISSN: 2395-0056 Volume: 06 Issue: 04 | Apr 2019 p-ISSN: 2395-0072 www.irjet.net 2. METHODOLOGY The main objective of this project is to develop a correlation between CBRs values and the basic index properties of the soil. To achieve the objectives of the research study, soil samples of varying geotechnical characteristics were collected from different parts of Ernakulam. Total 5 number of samples were collected from different project sites. SIEVE ANALYSIS Validity of the correlations from literature is also checked and compared with the models developed in the present study. ↓ ATTERBERG’S LIMIT TEST 3. TEST RESULTS ↓ STANDARD PROCTOR TEST ↓ CBR (soaked) TEST 2.1 PROCEDURE ADOPTED Based on the test results from the soil tests different relationships will be established between CBR soaked value, OMC, MDD, Liquid limit and plastic limit All the soil samples will be tested as per ASTM standards [xix-xxii]. The samples of soils are tested for establishment of correlations. Table -1: Criteria Of Pellinen Criteria Excellent R2 >0.9 4.1 DEVELOPMENT OF PREDICTION MODELS 0.4-0.67 Fair 0.2-0.39 Poor Very Poor <0.2 The strength of these relationships will be checked based on the (R2 value) criteria proposed by pellinen. (table 1.1). The low R2 value indicates high scatters in the data and very poor strength in he relationship and vice versa. © 2019, IRJET | Impact Factor value: 7.211 All the 5 soil samples were tested as per ASTM standards. Sieve analysis of the soil samples showed that soil samples can be classified as fine grained and coarse grained soil samples. Among these soil samples percentage of gravel was ranging from 15-38%, sand 7-17% and fines 0.45-5%. Atterberg’s limit test results of the soil samples showed that liquid limit is in a range of 24-32%, the plastic limit is in the range of 16-28%, and plasticity index is in the range of 1.99.9%. soil samples were classified as per USCS. Samples were classified as well graded sand, poorly graded gravel sand, gap graded silt sand, gap graded clayey gravel with sand and low plasticity lean clay soil. From standard proctor test results it was observed that the optimum moisture content is in the range of 16-22% and maximum dry density in a range of 1.62-2.55. Soaked CBR value was found ranging between 4-7.5%. 4. ANALYSIS PROCEDURE 0.7-0.86 Good A multiple regression analysis will be then trying to find an equation satisfying the test results and the goodness of fit statistics will be checked according to the conceptual criteria proposed by pellinen. Multiple Linear regression estimates the coefficients of the equation. To check the validity of developed correlations (separately for fine and coarse), experimental values of CBRs is plotted against predicted values of CBRs (using developed equations). Percentage error from 45degree line (equality line) will be calculated. | To fulfill the objectives of the study, the results out of laboratory experiments carried out were studied and were analyzed statistically. To build up a relation between CBR value and Index properties, regression models are used through Microsoft Excel software. In this study regression models were developed for estimating CBR value in terms of index properties. In the regression analysis the exact nature and form of mathematical equation is obtained and the regression coefficient is used for prediction. ISO 9001:2008 Certified Journal | Page 4030 International Research Journal of Engineering and Technology (IRJET) e-ISSN: 2395-0056 Volume: 06 Issue: 04 | Apr 2019 p-ISSN: 2395-0072 www.irjet.net Figure 1: Relationship between CBR soaked value and Plasticity index Figure 5: Relationship between CBR soaked value and Maximum Dry Density Figure 2: Relationship between CBR soaked value and Liquid Limit Figure 6: Relationship between CBR soaked value and Plastic Limit Figure 4 and 6 shows very poor correlation. The strength of these correlation is indicated by the R2 value 0.019 and 0.001 respectively. Similarly figure 5 and 1 also shows relatively fair correlation. The strength of these correlation is indicated by R2 value 0.325 and 0.696 respectively. And figure 2 and figure 3 shows a very strong excellent correlation indicated by R2 value 0.952 and 0.957 respectively. Figure 3: Relationship between Soaked CBR value and Coefficient of Uniformity A multiple regression modeling was then tried using Microsoft Excel Software and the goodness of fit statistics checked according to the conceptual criteria proposed by the pellinen shown in Table 1. Linear regression estimates the coefficients of linear and polynomial equations, involving one or more independent variables that best predict the value of the dependent variable. Regression analysis gives the different equations by correlating CBR value with different soil properties. Following correlations were developed by linear Regression analysis. CBR=-0.05OMC+7.02 (R2 = 0.019)………...(1) Figure 4: Relationship between CBR soaked value and OMC © 2019, IRJET | Impact Factor value: 7.211 | CBR=0.54MDD+5.14 (R2 = 0.32……………(2) CBR=0.113PI–1.5PI +10 (R2 = 0.696)……….(3) CBR=0.01PL+5.7 (R2 = 0.001)…………(4) CBR=-0.15LL2+8 LL-101 (R2 = 0.952)..................(5) ISO 9001:2008 Certified Journal | Page 4031 International Research Journal of Engineering and Technology (IRJET) e-ISSN: 2395-0056 Volume: 06 Issue: 04 | Apr 2019 p-ISSN: 2395-0072 www.irjet.net CBR=-0.07Cu2+0.95Cu+4.2 (R2= 0.957)……….......(6) CBR=2.6MDD–0.4PI+3.3 (R2=0.69)………….(7) Since the regression coefficient is very low and the strength of the correlation is very poor (eq1 & 4) it is easy to conclude that the variation in the index properties namely OMC and PL have no much influence on CBR Value. And hence the equation (1) and (4) is omitted. In multiple regression analysis, hence the index properties considered are only MDD, PI, LL, and Cu. And the equation obtained is, CBR=4MDD–0.3PI–0.4L–0.15Cu+11 (R2 =1)…...(8) Where CBR is the Soaked California Bearing Ratio value (%) MDD is Maximum dry density (g/cc), PI is Plasticity Index (%), PL is Plastic Limit (%), LL is the Liquid Limit (%), Cu is the Coefficient of Uniformity 5. VALIDITY OF DEVELOPED MODELS Validity of developed models are checked by plotting Experimental values of CBR against Predicted value of these CBR by developed equations. Percentage error from the equality line can be calculated by given formula, Percentage error = ……………(9) Where, A1 = Actual value, P1 = Predicted value, n = Number of values Figure 7: Validity Checking of equation 8 Because of the involvement of more than one variable in the predictive models the accurate prediction of the values of the soaked CBR becomes generally difficult. However, the predictive model presented in the present study are simple and can be effectively used for the prediction of the soaked CBR values with reasonable accuracy. CONCLUSION A number of soil samples were collected from different parts of Ernakulam District, Kerala to develop predictive models for locally available soils. These models are proposed after checking their strength based on R2 value and validity on real scale data. Simplified predictive curves are also presented to determine the soaked CBR value for soils from linear/polynomial multiple regression models proposed in the present study. Soaked California bearing ratio is a function of maximum dry density, liquid limit, coefficient of uniformity and plasticity index. From the greatest R2 Value and least percentage error, it is clear that a strong correlation exist in the equation (8), hence the valid prediction model is, Predictive model R2 Percentage Error -0.07Cu2+0.95Cu+4.2 0.957 ±2.2% -0.15LL2+8LL-101 0.952 ±6% CBR=4MDD–0.3PI–0.4LL–0.15Cu +11 4MDD–0.3PI–0.4LI– 0.15Cu+11 1 ±3% 2.6MDD-0.4PI+3.3 0.69 ±2% Models presented in the present study can be used to an extend, for the preliminary prediction of soaked CBR value for locally available soils of Ernakulam.However, such models can’t be the replacement of actual tests. VALIDITY CHECKING REFERENCES Validity of correlation from the literature review is also checked for the same set of samples and compared with the models developed in the present study. Based on the percentage error found, it is easy to arrive at a predictive model for determining the soaked CBR value using index properties. © 2019, IRJET | Impact Factor value: 7.211 | [1] W.P.M. Black. “A Method of estimating the CBR of cohesive soils from plasticity Data”, Geotechnique.Vol.12, 271 – 271, 1962. [2] K. B. Agarwal , K. D. Ghanekar. “Prediction of CBR values from plasticity characteristics of soil”. ISO 9001:2008 Certified Journal | Page 4032 International Research Journal of Engineering and Technology (IRJET) e-ISSN: 2395-0056 Volume: 06 Issue: 04 | Apr 2019 p-ISSN: 2395-0072 www.irjet.net [3] B. Yildirim, O. Gunaydin. “Estimation of CBR by soft computing systems”. Expert systems with Applications, Elsevier, 38, 6381 – 6391, 2011 [4] S. A. Nugroho, and R. N. Sri.”Canadian Journal on Environmental”, Construction and Engineering Vol. 3, No.1, January 2012. [5] Dr. K.R. Arora, “Soil mechanics and Foundation Engineering”, Standard Publishers Distributors. [6] IS 2720 Part 4 (1975) Grain Analysis [7] IS 2720 Part 5 (1970) Determination of Liquid Limit and Plastic Limit. [8] IS 2720 Part 6 (1974) Determination of Dry Density and Optimum Moisture Content. [9] IS 2720 Part 16 (1979) Determination of California Bearing Ratio. [10] Prediction of CBR from index properties, Available at https://www.researchgate.net. © 2019, IRJET | Impact Factor value: 7.211 | ISO 9001:2008 Certified Journal | Page 4033
