IRJET-Land Use & Land Cover Change Detection using G.I.S. & Remote Sensing
advertisement

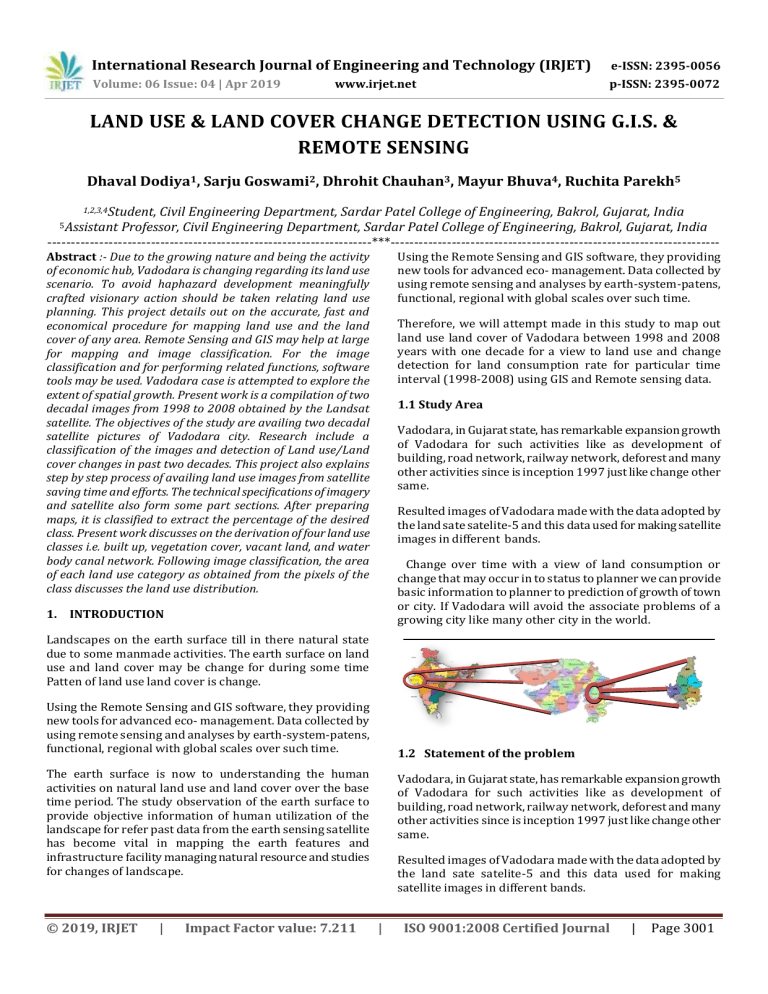
International Research Journal of Engineering and Technology (IRJET) e-ISSN: 2395-0056 Volume: 06 Issue: 04 | Apr 2019 p-ISSN: 2395-0072 www.irjet.net LAND USE & LAND COVER CHANGE DETECTION USING G.I.S. & REMOTE SENSING Dhaval Dodiya1, Sarju Goswami2, Dhrohit Chauhan3, Mayur Bhuva4, Ruchita Parekh5 1,2,3,4Student, Civil Engineering Department, Sardar Patel College of Engineering, Bakrol, Gujarat, India Professor, Civil Engineering Department, Sardar Patel College of Engineering, Bakrol, Gujarat, India ---------------------------------------------------------------------***---------------------------------------------------------------------5Assistant Abstract :- Due to the growing nature and being the activity of economic hub, Vadodara is changing regarding its land use scenario. To avoid haphazard development meaningfully crafted visionary action should be taken relating land use planning. This project details out on the accurate, fast and economical procedure for mapping land use and the land cover of any area. Remote Sensing and GIS may help at large for mapping and image classification. For the image classification and for performing related functions, software tools may be used. Vadodara case is attempted to explore the extent of spatial growth. Present work is a compilation of two decadal images from 1998 to 2008 obtained by the Landsat satellite. The objectives of the study are availing two decadal satellite pictures of Vadodara city. Research include a classification of the images and detection of Land use/Land cover changes in past two decades. This project also explains step by step process of availing land use images from satellite saving time and efforts. The technical specifications of imagery and satellite also form some part sections. After preparing maps, it is classified to extract the percentage of the desired class. Present work discusses on the derivation of four land use classes i.e. built up, vegetation cover, vacant land, and water body canal network. Following image classification, the area of each land use category as obtained from the pixels of the class discusses the land use distribution. Using the Remote Sensing and GIS software, they providing new tools for advanced eco- management. Data collected by using remote sensing and analyses by earth-system-patens, functional, regional with global scales over such time. Therefore, we will attempt made in this study to map out land use land cover of Vadodara between 1998 and 2008 years with one decade for a view to land use and change detection for land consumption rate for particular time interval (1998-2008) using GIS and Remote sensing data. 1.1 Study Area Vadodara, in Gujarat state, has remarkable expansion growth of Vadodara for such activities like as development of building, road network, railway network, deforest and many other activities since is inception 1997 just like change other same. Resulted images of Vadodara made with the data adopted by the land sate satelite-5 and this data used for making satellite images in different bands. Change over time with a view of land consumption or change that may occur in to status to planner we can provide basic information to planner to prediction of growth of town or city. If Vadodara will avoid the associate problems of a growing city like many other city in the world. 1. INTRODUCTION Landscapes on the earth surface till in there natural state due to some manmade activities. The earth surface on land use and land cover may be change for during some time Patten of land use land cover is change. Using the Remote Sensing and GIS software, they providing new tools for advanced eco- management. Data collected by using remote sensing and analyses by earth-system-patens, functional, regional with global scales over such time. 1.2 Statement of the problem The earth surface is now to understanding the human activities on natural land use and land cover over the base time period. The study observation of the earth surface to provide objective information of human utilization of the landscape for refer past data from the earth sensing satellite has become vital in mapping the earth features and infrastructure facility managing natural resource and studies for changes of landscape. © 2019, IRJET | Impact Factor value: 7.211 Vadodara, in Gujarat state, has remarkable expansion growth of Vadodara for such activities like as development of building, road network, railway network, deforest and many other activities since is inception 1997 just like change other same. Resulted images of Vadodara made with the data adopted by the land sate satelite-5 and this data used for making satellite images in different bands. | ISO 9001:2008 Certified Journal | Page 3001 International Research Journal of Engineering and Technology (IRJET) e-ISSN: 2395-0056 Volume: 06 Issue: 04 | Apr 2019 p-ISSN: 2395-0072 www.irjet.net Change over time with a view of land consumption or change that may occur in to status to planner we can provide basic information to planner to prediction of growth of town or city. If Vadodara will avoid the associate problems of a growing city like many other city in the world. 2.1.2 Geometric correction Geometric correction is the process of geo referencing the satellite imageries to UTM map projection system to the zone of interest and ratifying by using an evenly distributed control points taken from digitized topographic map of corresponding areas and re sampling to nearest neighborhood. Geometric correction include identifying the image coordinates similar with their true positions in ground coordinate and Re-sampling process is used to determine digital values to place in the new pixel locations of the corrected output images. There are three common methods for re sampling which are nearest neighbor, bilinear interpolation and cubic convolution. 2. METHODOLOGY 2.1.3 Radiometric correction Radiometric normalization of multi-date imageries is important stage in change detection analysis. High accuracy geometric registration of the multi-date image data is basic requirement for change detection. The reflectance values measured by the sensor are not the pure representation of the values reflected by earth surface features due to some external and in-sensor factors. Dealing with multi-date image datasets requires that images obtained by sensors at different times are comparable in terms of radiometric characteristics. So if any two or more datasets are to be used for quantitative analysis based on radiometric information as in the case of multi-date analysis for detecting surface changes, they may be adjusted to compensate for radiometric divergence. 2.1.4 Image enhancement Image enhancement is the process applied to image data in order to more effectively display or record the data for subsequent visual interpretation. Normally, image enhancement contains many ways and methods applied for increasing the visual distinguishing among structures in a scene. The intention is to form or create new imageries from an original image to increase the visual interpretation of image and to improve the visual interpretability of an image by increasing the apparent distinction between the features Three Broad approaches to enhancement includes manipulate the contrast of an image spatial feature manipulation and multiple spectral bands of imagery. Choosing the appropriate enhancement for any particular application is the most challenging and an art and often a matter of personal preference. 2.1 Data Eenhancement, processing and Integration 2.1.1 Image preprocessing Image preprocessing is challenging work in urban land cover change detection process. To identify land cover change with accurately and precisely between consecutive years, the atmosphere disturbance should be modeled so that it will not affect surface reflectance of land cover change detection process. The accomplishment of land cover change detection analysis by using multi-date remote sensing images depend on the accurate radiometric and geometric correction. Multitemporal Landsat imageries geometric correction and radiometric correction are most important. © 2019, IRJET | Impact Factor value: 7.211 2.2 Image classification process Digital image classification in remote sensing contains grouping of pixels of an image to set of classes, such that pixels in the similar class are having like properties. The common type of image classification is based on the detection of the spectral response patterns of land cover classes. Remote sensing studies aiming on image classification has long attracted the devotion of the remote-sensing community as classification results are the basis for many environmental | ISO 9001:2008 Certified Journal | Page 3002 International Research Journal of Engineering and Technology (IRJET) e-ISSN: 2395-0056 Volume: 06 Issue: 04 | Apr 2019 p-ISSN: 2395-0072 www.irjet.net and socioeconomic applications. Scientists and practitioners have made great efforts in developing advanced classification approaches and techniques for improving classification accuracy. However, classifying remotely sensed data into a thematic map remains a challenge because many factors, such as the complexity of the landscape in a study area, selected remotely sensed data, and image-processing and classification approaches, may affect the success of a classification. Many factors such as spatial resolution of the remotely sensed data, different sources of data a classification system and availability of classification software must be taken into account when selecting a classification method for use. Different classification methods have their own merits. The question of which classification approach is suitable for a specific study is not easy to answer. Different classification results may be obtained depending on the classifier chosen. 3. RESULT 3.1 Classification Classes (Supervised Classification) :- 2.2.1 Supervised classification Sr. No Class Description 1 Agriculture Land Garden, Play Ground, Trees 2 Forest Land Natural Vegetation, Trees 3 Built Up Land Residential Area, Commercial Area, Industrial Area, 4 Water Body Lakes, Rivers, Ponds, Canals 5 Road Network RCC road, Bituminous Road, WBM Road, 6 Barren Land Rock, Sand, Soil Supervised classification can be very effective and accurate in classifying satellite images and can be applied at the individual pixel level or to image objects However, for the process to work effectively, the person processing the image needs to have a priori knowledge of where the classes of interest are located, or be able to identify them directly from the imagery. 2.2.2 Unsupervised classification One common application of remotely-sensed images to rangeland management is the creation of maps of land cover, vegetation type, or other discrete classes by remote sensing software. In unsupervised classification, image processing software classifies an image based on natural groupings of the spectral properties of the pixels, without the user specifying how to classify any portion of the image. Conceptually, unsupervised classification is similar to cluster analysis where observations are assigned to the same class because they have similar values. 2.3 Classification accuracy assessment Accuracy assessment is very important for understanding the developed results and employing these results for decision-making. Classification accuracy assessment is very important in land use mapping and to understand map quality and reliability. Ultimately there is no satisfactory method to assess the absolute accuracy of image classification for remote sensing Earth observation applications. Even an assessment or an estimate of the relative accuracy of classification does, however, provide valuable knowledge for us to accept or reject a classification result at a certain confidence level. © 2019, IRJET | Impact Factor value: 7.211 Final Classification image 1998 | ISO 9001:2008 Certified Journal | Page 3003 International Research Journal of Engineering and Technology (IRJET) e-ISSN: 2395-0056 Volume: 06 Issue: 04 | Apr 2019 p-ISSN: 2395-0072 www.irjet.net Forest Area 15.114 7.434 7.68(-) Road Network 4.749 6.836 2.087(+) Water body 2.923 0.970 1.953(-) Built up area 32.084 41.682 9.598(+) Barren Land Total 32.076 100 33.755 100 1.679(+) - 3.4 Change Detection Graph in % Percentage :- Final Classification Image 2008 3.2 Area classification table :Class 4. CONCLUSION Area (Hector.) Year 1998 Year 2008 Agricultural Area Forest Area 8427.6 6217.74 9801.72 6350.13 Road Network 3167.1 4559.31 Water body 1949.58 646.86 Built up area 21397.41 27798.66 Barren Land Total 20556.63 66692.25 22511.79 66692.25 This Study work demonstrates the ability of GIS and Remote Sensing in capturing spatial-temporal data. Attempt was made to capture as accurate as possible four land use land cover classes as they change through time. The four classes were distinctly produced for each study year but with more emphasis on built-up land as it is a combination of anthropogenic activities that make up this class; and indeed, it is one that affects the other classes. However, the result of the work shows a rapid growth in built-up land between 1998 and 2008 is 9.598% while the periods between 1998 and 2008 the agricultural land is reduced in 3.731% of the study area. It was also observed that change by 1998 and 2008 the area of water body is slightly decreased by introduce to Vishwamitri River. Also the road network of the study area is increased by developing the city as well as the village facilities. Its change between 1998 and 2008 is 2.087% of the total area. REFERENCES 3.3 Area classification in percentage:Class % Percentage Year 1998 Agricultural Area © 2019, IRJET 13.054 | Monalisha Mishra, Kamal Kant Mishra, A.P. Subudhi. Urban sprawl mapping and Land Use change analysis using Remote Sensing and GIS: case study of Bhubaneswar city, Orissa. 2. [M. Modara, M. Ait Belaid, S. Al-Jenaid (2013). Mapping and assessing Land Use/ Land Cover change in Muharraq island based on GIS and Remote Sensing integration: case study of Muharraq Governorate. % Change Year 2008 9.323 1. 3.731(-) Impact Factor value: 7.211 | ISO 9001:2008 Certified Journal | Page 3004 3. International Research Journal of Engineering and Technology (IRJET) e-ISSN: 2395-0056 Volume: 06 Issue: 04 | Apr 2019 p-ISSN: 2395-0072 www.irjet.net ]. J.S. Rawat, Manish Kumar. Monitoring land use/cover change using remote sensing and GIS techniques: A case study of Hawalbagh block, district Almora, Uttarakhand, IndiaCentre of Excellence for NRDMS in Uttarakhand, 4. http://www.gadm.org/download 5. https://earthexplorer.usgs.gov © 2019, IRJET | Impact Factor value: 7.211 | ISO 9001:2008 Certified Journal | Page 3005


