IRJET- Rainfall-Runoff Analysis of the Watershed for River AIE
advertisement

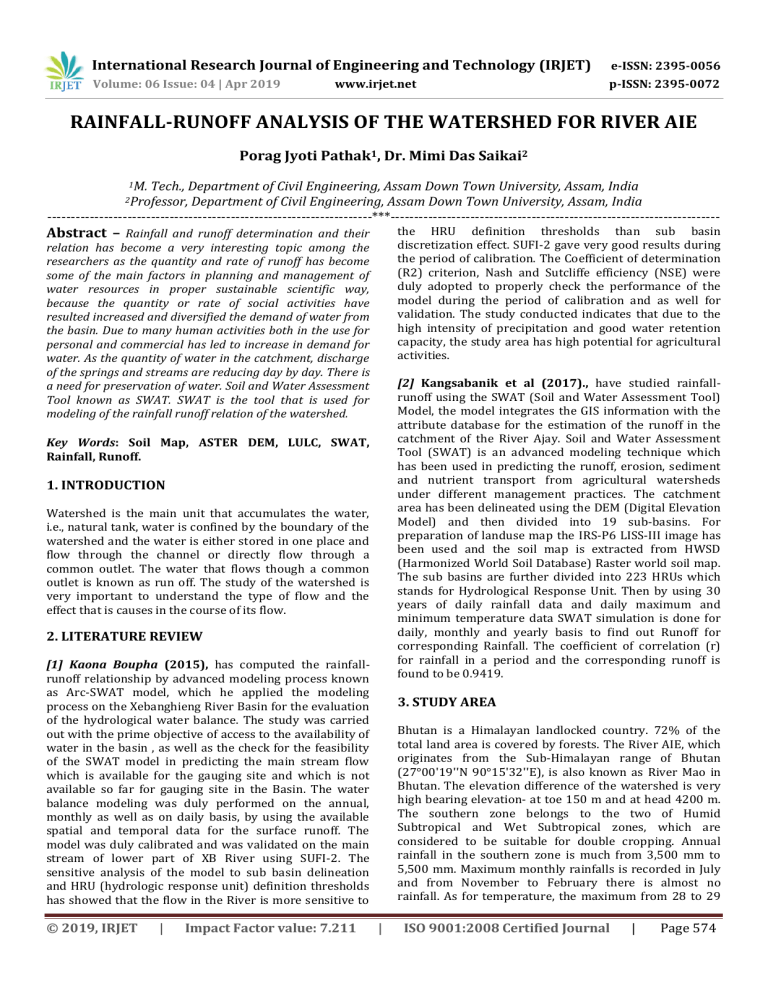
International Research Journal of Engineering and Technology (IRJET) e-ISSN: 2395-0056 Volume: 06 Issue: 04 | Apr 2019 p-ISSN: 2395-0072 www.irjet.net RAINFALL-RUNOFF ANALYSIS OF THE WATERSHED FOR RIVER AIE Porag Jyoti Pathak1, Dr. Mimi Das Saikai2 1M. Tech., Department of Civil Engineering, Assam Down Town University, Assam, India Department of Civil Engineering, Assam Down Town University, Assam, India ---------------------------------------------------------------------***---------------------------------------------------------------------2Professor, Abstract – Rainfall and runoff determination and their the HRU definition thresholds than sub basin discretization effect. SUFI-2 gave very good results during the period of calibration. The Coefficient of determination (R2) criterion, Nash and Sutcliffe efficiency (NSE) were duly adopted to properly check the performance of the model during the period of calibration and as well for validation. The study conducted indicates that due to the high intensity of precipitation and good water retention capacity, the study area has high potential for agricultural activities. relation has become a very interesting topic among the researchers as the quantity and rate of runoff has become some of the main factors in planning and management of water resources in proper sustainable scientific way, because the quantity or rate of social activities have resulted increased and diversified the demand of water from the basin. Due to many human activities both in the use for personal and commercial has led to increase in demand for water. As the quantity of water in the catchment, discharge of the springs and streams are reducing day by day. There is a need for preservation of water. Soil and Water Assessment Tool known as SWAT. SWAT is the tool that is used for modeling of the rainfall runoff relation of the watershed. [2] Kangsabanik et al (2017)., have studied rainfallrunoff using the SWAT (Soil and Water Assessment Tool) Model, the model integrates the GIS information with the attribute database for the estimation of the runoff in the catchment of the River Ajay. Soil and Water Assessment Tool (SWAT) is an advanced modeling technique which has been used in predicting the runoff, erosion, sediment and nutrient transport from agricultural watersheds under different management practices. The catchment area has been delineated using the DEM (Digital Elevation Model) and then divided into 19 sub-basins. For preparation of landuse map the IRS-P6 LISS-III image has been used and the soil map is extracted from HWSD (Harmonized World Soil Database) Raster world soil map. The sub basins are further divided into 223 HRUs which stands for Hydrological Response Unit. Then by using 30 years of daily rainfall data and daily maximum and minimum temperature data SWAT simulation is done for daily, monthly and yearly basis to find out Runoff for corresponding Rainfall. The coefficient of correlation (r) for rainfall in a period and the corresponding runoff is found to be 0.9419. Key Words: Soil Map, ASTER DEM, LULC, SWAT, Rainfall, Runoff. 1. INTRODUCTION Watershed is the main unit that accumulates the water, i.e., natural tank, water is confined by the boundary of the watershed and the water is either stored in one place and flow through the channel or directly flow through a common outlet. The water that flows though a common outlet is known as run off. The study of the watershed is very important to understand the type of flow and the effect that is causes in the course of its flow. 2. LITERATURE REVIEW [1] Kaona Boupha (2015), has computed the rainfallrunoff relationship by advanced modeling process known as Arc-SWAT model, which he applied the modeling process on the Xebanghieng River Basin for the evaluation of the hydrological water balance. The study was carried out with the prime objective of access to the availability of water in the basin , as well as the check for the feasibility of the SWAT model in predicting the main stream flow which is available for the gauging site and which is not available so far for gauging site in the Basin. The water balance modeling was duly performed on the annual, monthly as well as on daily basis, by using the available spatial and temporal data for the surface runoff. The model was duly calibrated and was validated on the main stream of lower part of XB River using SUFI-2. The sensitive analysis of the model to sub basin delineation and HRU (hydrologic response unit) definition thresholds has showed that the flow in the River is more sensitive to © 2019, IRJET | Impact Factor value: 7.211 3. STUDY AREA Bhutan is a Himalayan landlocked country. 72% of the total land area is covered by forests. The River AIE, which originates from the Sub-Himalayan range of Bhutan (27°00'19''N 90°15'32''E), is also known as River Mao in Bhutan. The elevation difference of the watershed is very high bearing elevation- at toe 150 m and at head 4200 m. The southern zone belongs to the two of Humid Subtropical and Wet Subtropical zones, which are considered to be suitable for double cropping. Annual rainfall in the southern zone is much from 3,500 mm to 5,500 mm. Maximum monthly rainfalls is recorded in July and from November to February there is almost no rainfall. As for temperature, the maximum from 28 to 29 | ISO 9001:2008 Certified Journal | Page 574 International Research Journal of Engineering and Technology (IRJET) e-ISSN: 2395-0056 Volume: 06 Issue: 04 | Apr 2019 p-ISSN: 2395-0072 www.irjet.net degrees occurs in June to August and the minimum from 23 to 24 degrees in December to January. The location map is shown in figure 1. 4.2. PREPARATION OF LAND USE AND LAND COVER MAP Land use land cover (LULC) map is the one of the most important map in processing the model. For the watershed of the study area, the LULC map was downloaded from the Bhutan Government website of Geospatial data, the data or LULC map is available for free use for various study works. Then the watershed area is extracted out from the entire map of LULC. 4.3. PREPARATION OF SOIL MAP The soil map was extracted from Food & Agriculture Organization (FAO) website. Firstly, the whole map of South East Asia was downloaded and the boundary of the study area was placed above the soil map and the required area was extracted and soil map was ready to give us the information of the type of soil exists. The downloaded map was attached internally with all the information about the soil and its behavior as well its chemical composition, etc. The type of soil in the study area is “Ao80-2bc-3651”, which is ORTHIC ACRISOLS. Orthic Acrisol soil is acidic in nature bearing low base status and strongly leached, this are infertile soil which gets chemically and organically degraded quickly and are erode easily with rainwater. 4.4. ACQUIRING OF METEOROLOGICAL DATA The software/tool used in determining the Rainfall-Runoff relation are as follows:- The data acquired from the global weather website, whose data are compatible with SWAT, the SWAT team acquire the data from various source and stored them in a proper format, even though the data are missing in between the data, the missing data are corrected towards the nearest data next to the missing data. The data available are Daily observed data for precipitation (mm), minimum temperature (°C) and maximum temperature (°C), wind speed (m/s), solar radiation (Mj/m2) and relative humidity, etc. The period of availability of data was from 01/01/1979 to 31/07/2014 for two stations. 1. ArcSWAT tool in ArcGIS software. 5. RESULT AND DISCUSSION The data used/collected in determining the RainfallRunoff relation are as follows:- The principles that involves in the estimation of surface runoff includes determination of water that is lost and flowed through the channel in the process during interception, infiltration and evapo-transpiration and various smaller causes. When precipitation takes place and rain water falls on the ground, the water movement through the valley is fully decided by the top-soil time on the ground as well the vegetation covers that restricts the movement of the water initially. The water firstly penetrates through the ground and recharges the aquifer as long as the soil is not fully saturated, as the soil gets fully saturated the water starts flowing though the ground various other water lost procedures starts like evapotranspiration as well evaporation from the areas of depression along the flow of water in the slopes where small quantity of water gets stored. And lastly the water Figure.1. Location Map of River Aie at Bhutan. 4. MATERIALS AND METHODOLOGY 4.1. PREPARATION OF SPATIAL DATA ASTER DEM was used in the spatial data preparation, as the watershed of the my study area falls on Bhutan, the ASTER DEM image was the most clear among rest as the data of rest Dem format has lots of distortions and the visibility was very low in extracting the exact location of the watershed. ASTER DEM bears 90.00m resolution. The highest and lowest point elevation values from DEM are 237m and 4194 m above mean Sea level respectively. The watershed area of River AIE was extracted from the whole DEM. © 2019, IRJET | Impact Factor value: 7.211 | ISO 9001:2008 Certified Journal | Page 575 International Research Journal of Engineering and Technology (IRJET) e-ISSN: 2395-0056 Volume: 06 Issue: 04 | Apr 2019 p-ISSN: 2395-0072 www.irjet.net after balancing all the needs flows down towards the outlet as runoff and flows through the River and meets its sink after heading miles. ArcSWAT is used here to determine the rainfall runoff relationship on daily basis. SWAT is used as a tool here to determine the Rainfallrunoff relation because the study area lies beyond the boundary of our country, India which is Bhutan, acquiring data from Bhutan was not possible in a short span of time and after acquiring information of non availability of station for collection of data at the up-hill of the watershed area, I had to use SWAT tool as it provides global data from un-gauged areas, which is free to use and the data were framed by SWAT team from their source and which was declared as near to correct data for analysis of various parameters. the Land Use map is inserted for the processing (Figure.3) and the various land use are indentified and selected in the drop down menu for properly designating the type of land use and the output is established. The steps involved in determining the Rainfall-Runoff relation are as follows:5.1. WATERSHED DELINEATION Delineation is the foremost work during a satellite image processing. Firstly the watershed is clipped to confine the required area and Digital Elevation Model Showing elevations were created. Figure.3. LAND USE LAND COVER Output Secondly, Soil Map is inserted for processing and the correct soil type is selected from the drop down menu and the output is established (Figure.4.) Figure.2. Digital Elevation Model The watershed delineation (Figure.2) is automatic in ArcSWAT tool, the data has to be fed into the required field and the delineation process starts and the area is delineated along with extraction of pour point, creation of sub-basin and drainage in watershed Delineator. Figure.4. Output of Soil Map Thirdly, Slope is derived by giving the limits to divide the slope class, so that a proper and distinct variation can be visualized at the output (Figure.5.). Slope is classified here into 4 groups:i). Slope class 1= 00 % - 20 % ii). Slope class 2= 20 %- 40 % iii). Slope class 3= 40 % - 60 % iv). Slope class 4= 60 % - 99 %. 5.2. HRU ANALYSIS Hydrologic response units (HRU) are the identical areas of similar land-use type and soils located at different locations within a sub-basin. In the HRU Analysis, firstly © 2019, IRJET | Impact Factor value: 7.211 | ISO 9001:2008 Certified Journal | Page 576 International Research Journal of Engineering and Technology (IRJET) e-ISSN: 2395-0056 Volume: 06 Issue: 04 | Apr 2019 p-ISSN: 2395-0072 www.irjet.net After performing all the three steps, overlay is performed. 5.3. WEATHER DATA INPUT The Global Weather data were inserted in the various fields such as temperature, rainfall, wind speed, solar radiation, and relative humidity of the study area to the model in the write input tables command in the ArcSWAT, the custom weather data i.e., “WGEN_CFSR_World” was selected in the location table. The data was provided by the SWAT team through Global Weather Data website. In my study area, there were 2 stations bearing data from1979 to 2014.The inputs were provided on daily basis to the model through weather data definition options, they are as follows:i) precipitation, ii) minimum and maximum temperature, iii)solar radiation, iv) wind speed and v) relative humidity. 5.4. SWAT DATABASE As all the definitions were set at various step towards the required data for the model, the SWAT starts making its database according to the data fed and prepare itself to give a better and effective feedback towards the instructions fed to the model on the later part of the modeling. Figure.5. Output of Soil Map Lastly, the HRUs thresholds were defined individually one after another. Here, in my study area, the thresholds were defined as 12% for land use, 15% for soil and 15% for slope. Firstly, SWAT determines the land use classes, which exceed or equal to 12% of the sub-basin area, after that it starts to select the soil types which exceed or equal to 15% of the area of the selected land use, followed by the slopes. 5.5. SIMULATION OF THE MODEL Simulation is the virtual diagram prepared based on the data fed to the system considering some limitations and certain specific rules and formulae. Simulation has helped us get a brief idea for the forecasting of various conditions that may rise in the future or pattern of sudden change that may take place, it is a pre-warning model to various backgrounds. Here, in this model an attempt was made to get the systematic view of the watershed and its behavior towards the precipitation that falls on the watershed and its capacity to hold the water or its flow condition. As the watershed area is un-gauged area simulation helps us in determining a clear view for the watershed. Simulation of the model must be done very carefully and the data fed must be correct, to get a correct output from the simulation of the model. The output sheet (Figure.6) is generated and the output after processing was 69 numbers of HRUs in 23 numbers of sub-basins. Also information of every individual HRUs were generated in the final HRU distribution tab of Arc SWAT and the watershed can be easily visualized. In this model, simulation was done for a period of 20 years i.e., from 01/01/1995 to 31/01/2014 in which for the better performance a Three years warm-up time was considered with SWAT.exe was considered 32-bit, and rainfall distribution was considered as Skewed normal distribution Output of simulation (Figure.7) for the data input from 01/01/1995 to 31/01/2014 with warm up year = 3years. Table.1. shows the Water balance of AIE basin generated by SWAT. Figure.6. Output of HRU Analysis © 2019, IRJET | Impact Factor value: 7.211 | ISO 9001:2008 Certified Journal | Page 577 International Research Journal of Engineering and Technology (IRJET) e-ISSN: 2395-0056 Volume: 06 Issue: 04 | Apr 2019 p-ISSN: 2395-0072 www.irjet.net gauged trans-boundary study area has many limitations in getting proper data for execution of work for determining the objective; ArcSWAT has played a very important role in processing the data available to get its output. During the study of data for a span of 20 years, i.e., from 1995 to 2014 with a warm up of 3 years for the better performance of the output, the output fetched shows a huge quantity of precipitation took place in the study area with an avg. precipitation of 5585.70 mm and avg. runoff of 2682.51 mm. Therefore it can be seen that 48.00% of water in the form of surface runoff flows down the watershed quickly. Therefore is can be concluded that due to steep slope, the water quickly flows down the watershed with high velocity. ACKNOWLEDGEMENT The author is very grateful to Mrs. Meena Singha madam for imparting knowledge on RS and GIS, which has helped in completing the research work. REFERENCES Figure.7. Water balance of AIE basin by SWAT CHECK Sl.No. Component of hydrological [1] Kaona Boupha., ”Rainfall-Runoff Simulation using Remote Sensing and GIS Tool (SWAT Model)”, Journal of Natural Sciences Research ISSN 2224-3186 (Paper) ISSN 2225-0921 (Online) Vol.5, No.1, 2015. Quantity cycle 1 2 Average Annual Precipitation (mm) Evaporation and Transpiration (mm) 731.00 3 Surface Runoff (mm) 2682.51 4 Lateral Flow (mm) 896.15 5 Return flow (mm) 1169.95 6 7 Percolation to shallow aquifer (mm) Revap from Shallow aquifer (mm) [2] Kangsabanik Subhadip Murmu Sneha.,” Rainfall-runoff modelling of Ajay River catchment using SWAT model”, 7th International Conference on Environment and Industrial Innovation IOP Publishing IOP Conf. Series: Earth and Environmental Science 67 (2017) 012033 doi: 10.1088/1755-1315/67/1/012033. 5585.70 [3] Gajbhiye Sarita.,”Estimation of surface runoff using Remote Sensing and Geographical Information System”., International Journal Of U- And E- Service, Science And Technology Vol.8, No.4 (2015), Pp.113- 122. [4] Pradhan Ratika, Pradhan Mohan., Ghose M. K., Agarwal Vivek S., Agarwal Shakshi., ”Estimation of rainfall-runoff using Remote Sensing and GIS in and around Singtam, East Sikkim”, International Journal Of Geomatics And Geosciences, Volume 1, No 3, 2010. 1261.75 23.74 8 Recharge to deep aquifer (mm) 63.09 9 Average Curve number 76.68 Table.1. Water balance of AIE basin generated by SWAT 6. CONCLUSION Modeling using ArcSWAT has played a very big role in determining or predicting various situations as a part of study or pre warning tool for many researchers. An un- © 2019, IRJET | Impact Factor value: 7.211 | ISO 9001:2008 Certified Journal | Page 578


