IRJET-Orchard Tree Canopy Detection
advertisement

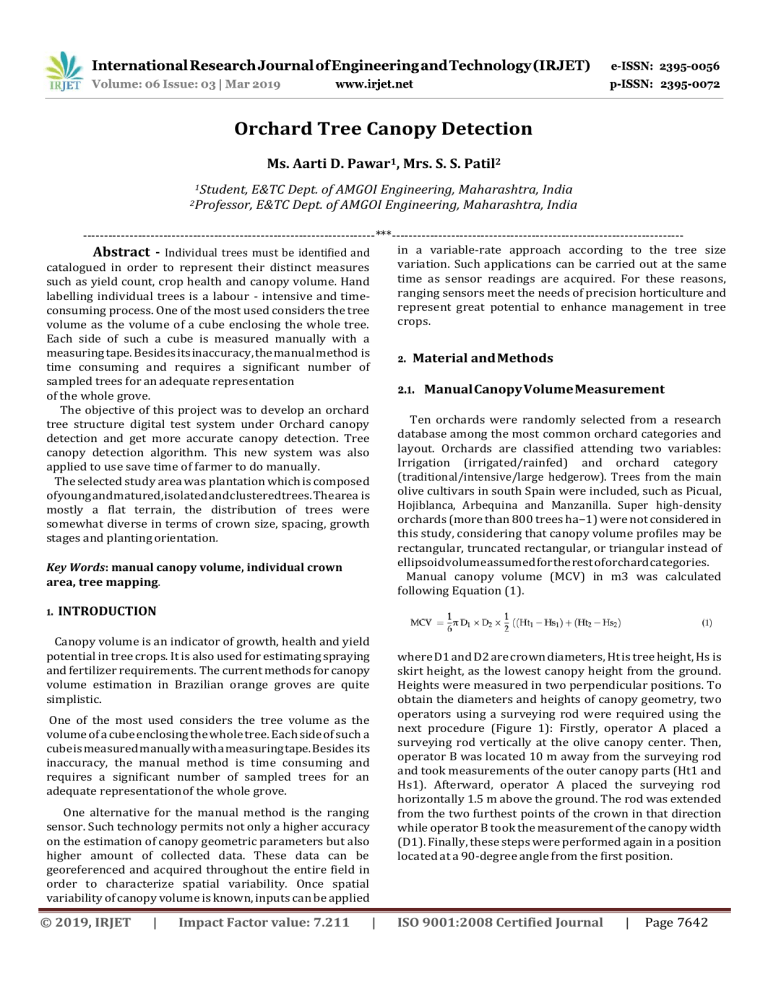
Orchard Tree Canopy Detection Ms. Aarti D. Pawar1, Mrs. S. S. Patil2 1Student, E&TC Dept. of AMGOI Engineering, Maharashtra, India E&TC Dept. of AMGOI Engineering, Maharashtra, India 2Professor, ---------------------------------------------------------------------***--------------------------------------------------------------------in a variable-rate approach according to the tree size variation. Such applications can be carried out at the same time as sensor readings are acquired. For these reasons, ranging sensors meet the needs of precision horticulture and represent great potential to enhance management in tree crops. Abstract - Individual trees must be identified and catalogued in order to represent their distinct measures such as yield count, crop health and canopy volume. Hand labelling individual trees is a labour - intensive and timeconsuming process. One of the most used considers the tree volume as the volume of a cube enclosing the whole tree. Each side of such a cube is measured manually with a measuring tape. Besides its inaccuracy, the manual method is time consuming and requires a significant number of sampled trees for an adequate representation of the whole grove. The objective of this project was to develop an orchard tree structure digital test system under Orchard canopy detection and get more accurate canopy detection. Tree canopy detection algorithm. This new system was also applied to use save time of farmer to do manually. The selected study area was plantation which is composed of young and matured, isolated and clustered trees. The area is mostly a flat terrain, the distribution of trees were somewhat diverse in terms of crown size, spacing, growth stages and planting orientation. 2. Material and Methods 2.1. Manual Canopy Volume Measurement Ten orchards were randomly selected from a research database among the most common orchard categories and layout. Orchards are classified attending two variables: Irrigation (irrigated/rainfed) and orchard category (traditional/intensive/large hedgerow). Trees from the main olive cultivars in south Spain were included, such as Picual, Hojiblanca, Arbequina and Manzanilla. Super high-density orchards (more than 800 trees ha−1) were not considered in this study, considering that canopy volume profiles may be rectangular, truncated rectangular, or triangular instead of ellipsoid volume assumed for the rest of orchard categories. Manual canopy volume (MCV) in m3 was calculated following Equation (1). Key Words: manual canopy volume, individual crown area, tree mapping. 1. INTRODUCTION Canopy volume is an indicator of growth, health and yield potential in tree crops. It is also used for estimating spraying and fertilizer requirements. The current methods for canopy volume estimation in Brazilian orange groves are quite simplistic. where D1 and D2 are crown diameters, Ht is tree height, Hs is skirt height, as the lowest canopy height from the ground. Heights were measured in two perpendicular positions. To obtain the diameters and heights of canopy geometry, two operators using a surveying rod were required using the next procedure (Figure 1): Firstly, operator A placed a surveying rod vertically at the olive canopy center. Then, operator B was located 10 m away from the surveying rod and took measurements of the outer canopy parts (Ht1 and Hs1). Afterward, operator A placed the surveying rod horizontally 1.5 m above the ground. The rod was extended from the two furthest points of the crown in that direction while operator B took the measurement of the canopy width (D1). Finally, these steps were performed again in a position located at a 90-degree angle from the first position. One of the most used considers the tree volume as the volume of a cube enclosing the whole tree. Each side of such a cube is measured manually with a measuring tape. Besides its inaccuracy, the manual method is time consuming and requires a significant number of sampled trees for an adequate representation of the whole grove. One alternative for the manual method is the ranging sensor. Such technology permits not only a higher accuracy on the estimation of canopy geometric parameters but also higher amount of collected data. These data can be georeferenced and acquired throughout the entire field in order to characterize spatial variability. Once spatial variability of canopy volume is known, inputs can be applied © 2019, IRJET | Impact Factor value: 7.211 | ISO 9001:2008 Certified Journal | Page 7642 compare the both data as sensor measurement and the camera measurement. When the slider moves along the guide, the sensor can obtain the distance between the tree and the sensor as well as camera take images and send to the LabVIEW to process. A series of distances from different height can be processed into Access database. According to those distances, the volume of the tree canopy can be obtained. 2.3 Analysis of digital canopy volume measurement Figure 3 shows the flowchart for the Analysis of digital canopy volume measurement Fig-1. Manual Canopy Volume(MCV) 2.2 Digital Canopy Volume Measurement An orchard tree structure digital measurement system, which includes a conveying platform, Raspberry-Pi, camera and LabVIEW for image processing (Fig-2). Fig-2.Block diagram of proposed system Fig-3.Flowchart of Analysis of digital canopy volume measurement The conveying platform contains a guide, a slider and an aluminum bar. In the guide there is a step motor which can precisely move the slider along the guide. The bar is vertical to the ground, which is used to fix sensor and camera. Raspberry-Pi is a core unit of the digital measurement which can not only read sensor data, Process the data, and send the result to the LCD display, but also can receive the data from PC to © 2019, IRJET | Impact Factor value: 7.211 The flowchart of Figure 3 is explained below: Step1:- Start initializing Raspberry-Pi. Send the information to the motor driver and control the motion of slider. Step2a:-Acquires distance information using sensor and send it to the analog to digital | ISO 9001:2008 Certified Journal | Page 7643 converter. That digital signal now Process by The controller. Step2b:- Capture the image by camera, at the same time of sensor acquire the distance and send to the LabVIEW to do image processing on that image. Step3:- compare process data of sensor as well as data send by LabVIEW and display individual tree crown on LCD display as well as PC. 3. CONCLUSIONS Crown features measurement provide very valuable maps for farmers, agricultural insurance systems and researchers to characterize an orchard, to enhance orchard management and to predict economic, agronomical or social aspects. REFERENCES [1] [2] [3] [4] [5] [6] Hanzhe Li, Changyuan Zhai , Paul Weckler , Ning Wang , Shuo Yang and Bo Zhang, “A Canopy Density Model for Planar Orchard Target Detection Based on Ultrasonic Sensors”, MDPI Journal of Sensors 2017. Changyuan Zhai, Xiu Wang, Chunjiang Zhao, Wei Zou, Dayin Liu, Yijin Mao, “Orchard tree structure digital test system and its application”, Elsevier Journal of Mathematical and Computer Modelling 54, 2011 Philippe Maillard, Marilia F. Gomes, “Detection and counting of orchard trees from VHR images using a Geometrical-Optical model and marked template matching”, ISPRS Annals of the Photogrammetry, Remote Sensing and Spatial Information Sciences, Volume III-7, 2016. Miguelito F. Isip, Eliza E. Camaso, Guiller B. Damian, Ronaldo T. Alberto, “Estimation of Mango Tree Count and Crown Cover Delineation using Template Matching Algorithm”, International Journal for Research in Applied Science & Engineering Technology, Volume 6 Issue III, March 2018. Rafael R. Sola-Guirado , Francisco J. Castillo-Ruiz, Francisco Jiménez-Jiménez, Gregorio L. Blanco-Roldan, Sergio Castro-Garcia and Jesus A. Gil-Ribes, “Olive Actual “on Year” Yield Forecast Tool Based on the Tree Canopy Geometry Using UAS Imagery”, MDPI Journal of Sensors 2017. Stephanie Delalieux, Pablo J. Zarco-Tejada, Laurent Tits, Miguel Ángel Jiménez Bello, Diego S. Intrigliolo, and Ben Somers, “Unmixing-Based Fusion of Hyperspatial and Hyperspectral Airborne Imagery for Early Detection of Vegetation Stress”, IEEE Journal Of Selected Topics In Applied Earth Observations And Remote Sensing, Vol. 7, No. 6, June 2014. © 2019, IRJET | Impact Factor value: 7.211 | ISO 9001:2008 Certified Journal | Page 7644


