IRJET-Effect of Response Reduction Factor on R.C Building with Different Infill Material
advertisement
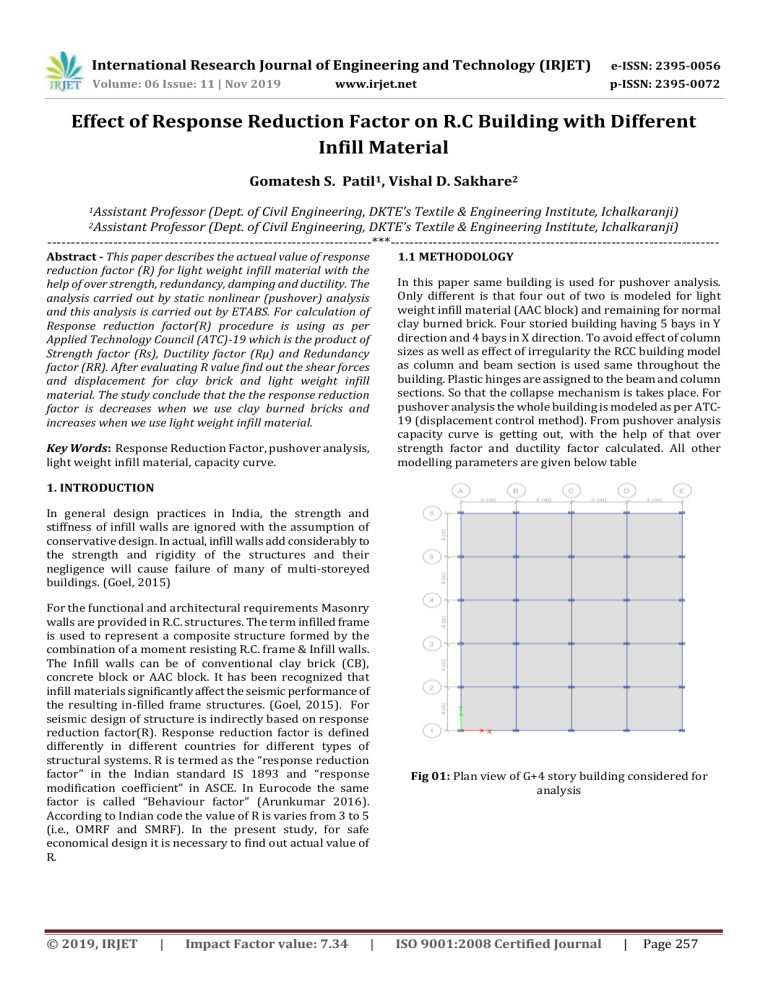
International Research Journal of Engineering and Technology (IRJET) e-ISSN: 2395-0056 Volume: 06 Issue: 11 | Nov 2019 p-ISSN: 2395-0072 www.irjet.net Effect of Response Reduction Factor on R.C Building with Different Infill Material Gomatesh S. Patil1, Vishal D. Sakhare2 1Assistant Professor (Dept. of Civil Engineering, DKTE’s Textile & Engineering Institute, Ichalkaranji) Professor (Dept. of Civil Engineering, DKTE’s Textile & Engineering Institute, Ichalkaranji) ---------------------------------------------------------------------***---------------------------------------------------------------------2Assistant Abstract - This paper describes the actueal value of response reduction factor (R) for light weight infill material with the help of over strength, redundancy, damping and ductility. The analysis carried out by static nonlinear (pushover) analysis and this analysis is carried out by ETABS. For calculation of Response reduction factor(R) procedure is using as per Applied Technology Council (ATC)-19 which is the product of Strength factor (Rs), Ductility factor (Rμ) and Redundancy factor (RR). After evaluating R value find out the shear forces and displacement for clay brick and light weight infill material. The study conclude that the the response reduction factor is decreases when we use clay burned bricks and increases when we use light weight infill material. 1.1 METHODOLOGY Key Words: Response Reduction Factor, pushover analysis, light weight infill material, capacity curve. In this paper same building is used for pushover analysis. Only different is that four out of two is modeled for light weight infill material (AAC block) and remaining for normal clay burned brick. Four storied building having 5 bays in Y direction and 4 bays in X direction. To avoid effect of column sizes as well as effect of irregularity the RCC building model as column and beam section is used same throughout the building. Plastic hinges are assigned to the beam and column sections. So that the collapse mechanism is takes place. For pushover analysis the whole building is modeled as per ATC19 (displacement control method). From pushover analysis capacity curve is getting out, with the help of that over strength factor and ductility factor calculated. All other modelling parameters are given below table 1. INTRODUCTION In general design practices in India, the strength and stiffness of infill walls are ignored with the assumption of conservative design. In actual, infill walls add considerably to the strength and rigidity of the structures and their negligence will cause failure of many of multi-storeyed buildings. (Goel, 2015) For the functional and architectural requirements Masonry walls are provided in R.C. structures. The term infilled frame is used to represent a composite structure formed by the combination of a moment resisting R.C. frame & Infill walls. The Infill walls can be of conventional clay brick (CB), concrete block or AAC block. It has been recognized that infill materials significantly affect the seismic performance of the resulting in-filled frame structures. (Goel, 2015). For seismic design of structure is indirectly based on response reduction factor(R). Response reduction factor is defined differently in different countries for different types of structural systems. R is termed as the “response reduction factor” in the Indian standard IS 1893 and “response modification coefficient” in ASCE. In Eurocode the same factor is called “Behaviour factor” (Arunkumar 2016). According to Indian code the value of R is varies from 3 to 5 (i.e., OMRF and SMRF). In the present study, for safe economical design it is necessary to find out actual value of R. © 2019, IRJET | Impact Factor value: 7.34 | Fig 01: Plan view of G+4 story building considered for analysis ISO 9001:2008 Certified Journal | Page 257 International Research Journal of Engineering and Technology (IRJET) e-ISSN: 2395-0056 Volume: 06 Issue: 11 | Nov 2019 p-ISSN: 2395-0072 www.irjet.net 2. Analysis and result discussion Fig 02: 3D view of G+4 story building considered for analysis Chart 01: Pushover curve for 1st model Table -1: Modelling parameters Sr. No. 1 DESCRIPTION SIZE The above capacity curve is obtained from pushover analysis. With the help of this curve the following results have been taken. Dimensions 16m X 20m Ultimate base shear (Vu) = 1623.51 KN 4 5 Spacing in X-directions Spacing in Y-directions 4m 4m Design base shear (Vu) = 1207.27 KN 6 7 Height of story Number of story 3m G+4 8 9 Height of building Materials 13.5m M-25, Fe 500 10 11 Beam Column 0.23m X 0.38m 0.23m X 0.45m 12 Thickness of slab 0.125 13 14 Live load Floor finish 2 1 15 16 0.16 (III) 5 (SMRF) 17 Zone factor (Z) Response reduction factor (R) Soil type 18 Importance factor (I) 1 Ultimate displacement (∆max) = 50.67 mm Yield displacement (∆u) = 14.95 mm Overstrength factor (Rs) = = = 1.344 Ductility reduction factor (Rµ) = = II = 3.389 Redundancy factor (RR) = 1 Load Combination: Response reduction factor = Rs X Rµ X RR Table 2: Loading combinations as per IS 1893:2016 (part1). Sr. No. 1 Load Combinations Case Combo 1 1.5 (DL + IL) 2 Combo 2 1.2 (DL + IL+ EL) 3 Combo 2 1.5(DL + EL) 4 Combo 2 0.9 DL + 1.5 EL) © 2019, IRJET | Impact Factor value: 7.34 = 1.344 X 3.389 X 1 = 4.554 | ISO 9001:2008 Certified Journal | Page 258 International Research Journal of Engineering and Technology (IRJET) e-ISSN: 2395-0056 Volume: 06 Issue: 11 | Nov 2019 p-ISSN: 2395-0072 www.irjet.net Chart 03: Story Displacement Vs No. of Story. Chart 02: Pushover curve for 2nd model The above capacity curve is obtained from pushover analysis. With the help of this curve the following results have been taken. Ultimate base shear (Vu) = 1606.29 KN Design base shear (Vu) = 1171.84 KN Ultimate displacement (∆max) = 56.32 mm Yield displacement (∆u) = 14.90 mm Chart 02: Story Displacement Vs No. of Story. Overstrength factor (Rs) = = 1.371 Ductility reduction factor (Rµ) = = 3.77 Redundancy factor (RR) = 1 Chart 04: Base shear Vs No. of Story. Response reduction factor = Rs X Rµ X RR = 1.371 X 3.77 X 1 = 5.17 Comparison of evaluated response reduction factor with actual response reduction factor: Chart 05: Base shear Vs No. of Story. © 2019, IRJET | Impact Factor value: 7.34 | ISO 9001:2008 Certified Journal | Page 259 International Research Journal of Engineering and Technology (IRJET) e-ISSN: 2395-0056 Volume: 06 Issue: 11 | Nov 2019 p-ISSN: 2395-0072 www.irjet.net Result and discussion [6] Mehmet Metin Kose, “Parameters affecting the fundamental period of RC buildings with infill walls” Engineering Structures 31, (2009) pp. 93-102. [7] Samar A. Barakat, Abdallah I. Husein Malkawi and Anis S. Al-Shatnawi, “A Step Towards Evaluation of the Seismic Response Reduction Factor in Multi-storey Reinforced Concrete Frames” Jordon University of Science and Technology, natural hazards 16: (1996) pp. 65-80 [8] S. N. Tande, R. V. Ambekar, “An Investigation of Seismic Response Reduction Factor for Earthquake Resistant Design”, International Journal of Latest Trends in Engineering and Technology (IJLTET), ISSN: 2278-621X, Vol. 2: (2013) pp. 391-396. Based on software analysis, response reduction factor, story shear and story displacement are compared. ` Table -3: Comparison of clay burned brick and light weight infill material (AAC block). Clay burned brick Response reduction factor R story shear story displacement Evaluat ed value of R Actual value of R Light weight infill material Evaluat Actual ed value value of R of R 4.55 5 5.17 5 737.05 19.41 667.62 17.60 537.71 14.154 555.99 14.63 3. CONCLUSIONS From the above analysis it is clear that the response reduction factor is decreases when we use clay burned bricks and increases when we use light weight infill material. It is more dangerous when the value of response reduction factor R decreases. Because the value of base shear and story displacement are increases. REFERENCES [1] Apurba Mondal, Siddhartha Ghosh, G.R. Reddy, “Performance-based evaluation of the response reduction factor for ductile RC frames” Engineering Structures 56, (2013) pp. 1808–1819. [2] Bhavin Patel and Dhara Shah, “Formulation of Response Reduction Factor for RCC Framed Staging of Elevated Water Tank using Static Pushover Analysis”, World Congress on Engineering Vol. III: (2010) pp. 978-988. [3] Divya Brahmavrathan and C. Arunkumar, “Evaluation of Response Reduction Factor of Irregular Reinforced Concrete Framed Structures” Indian Journal of Science and Technology, ISSN: Vol 9 (23), (2016) pp. 1-8. [4] Enzo Martinelli, Carmine Lima, Gaetano De Stefano, “A simplified procedure for Nonlinear Static analysis of masonry infilled RC frames” Engineering Structures 101 (2015) pp. 591–608. [5] KAJAL GOEL, “Influence of Masonry Infill Walls on Seismic Performance of RC Framed Structures-A Comparison of AAC and Conventional Brick Infill”, International Research Journal of Engineering and Technology (IRJET) (2015) Volume: 02 Issue: 06. © 2019, IRJET | Impact Factor value: 7.34 | ISO 9001:2008 Certified Journal | Page 260
