Genetic Mutations Lab: M&M Simulation
advertisement

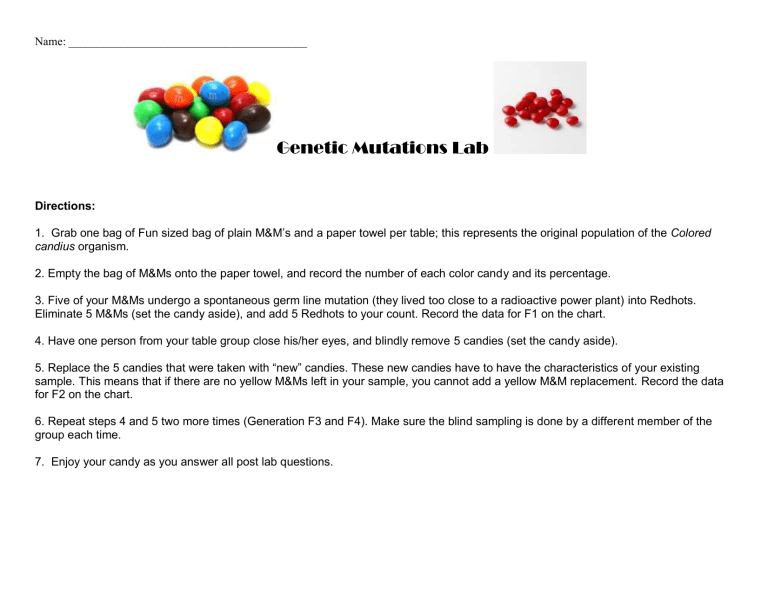
Name: _________________________________________ Genetic Mutations Lab Directions: 1. Grab one bag of Fun sized bag of plain M&M’s and a paper towel per table; this represents the original population of the Colored candius organism. 2. Empty the bag of M&Ms onto the paper towel, and record the number of each color candy and its percentage. 3. Five of your M&Ms undergo a spontaneous germ line mutation (they lived too close to a radioactive power plant) into Redhots. Eliminate 5 M&Ms (set the candy aside), and add 5 Redhots to your count. Record the data for F1 on the chart. 4. Have one person from your table group close his/her eyes, and blindly remove 5 candies (set the candy aside). 5. Replace the 5 candies that were taken with “new” candies. These new candies have to have the characteristics of your existing sample. This means that if there are no yellow M&Ms left in your sample, you cannot add a yellow M&M replacement. Record the data for F2 on the chart. 6. Repeat steps 4 and 5 two more times (Generation F3 and F4). Make sure the blind sampling is done by a different member of the group each time. 7. Enjoy your candy as you answer all post lab questions. Name: _________________________________________ Mutations in Colored candius Color of candy from original population # of each color from original population (F1) Blue Green Orange Yellow Red Brown % of each color from original population Mutation is introduced (F1) Blue Green Orange Yellow Red Brown Redhots Total # of candy in original population = # of each color in F2 5 % of each color in F2 # of each color in F3 % of each color in F3 # of each color in F4 % of each color in F4 # of each color in F5 % of each color in F5 Name: _________________________________________ Post lab questions: 1. Look at the data for F1 (where the mutation originally occurs), and the data at F4. Did the mutation become more prevalent as time went on? Use your data as evidence. 2. Is your answer in 1 true for all other table groups? (Yes, go and visit with at least two other tables and include their data in your answer.) What could account for the differences? 3. Did any trait (M&M color) totally disappear in your population? Why might this happen? Name: _________________________________________ 4. In this activity, the mutation did not help or hinder your population. Explain how your results would have changed if you had been allowed to see the candies you were picking off. 5. Let's assume that the Redhot mutation is poisonous to the Glutonous organism that thrives on eating Colored candius. Determine if this would be a beneficial mutation or not and explain how this could affect the population of Colored candius. 6. Assuming that the Redhot mutation is preferred by the Glutonous organism that thrives on eating Colored candius. Determine if this would be a beneficial mutation or not and explain how this could affect the population of Colored candius.


