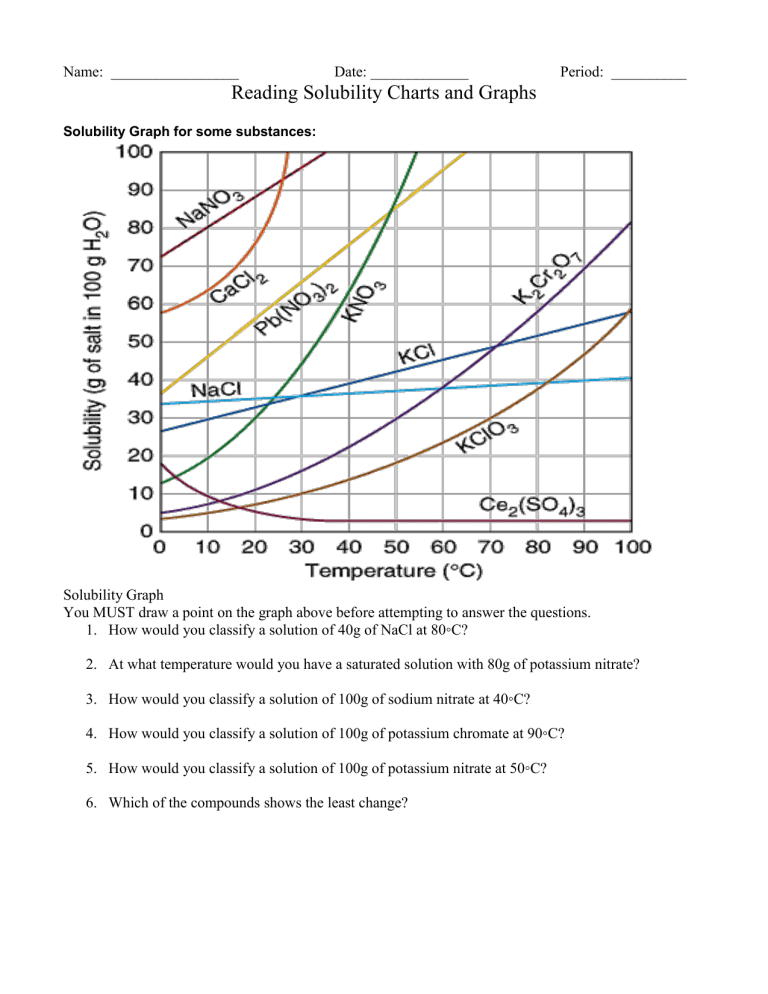
Name: _________________ Date: _____________ Period: __________ Reading Solubility Charts and Graphs Solubility Graph for some substances: Solubility Graph You MUST draw a point on the graph above before attempting to answer the questions. 1. How would you classify a solution of 40g of NaCl at 80◦C? 2. At what temperature would you have a saturated solution with 80g of potassium nitrate? 3. How would you classify a solution of 100g of sodium nitrate at 40◦C? 4. How would you classify a solution of 100g of potassium chromate at 90◦C? 5. How would you classify a solution of 100g of potassium nitrate at 50◦C? 6. Which of the compounds shows the least change? Solubility of Compounds in g/100g of Water at various Temperatures Compound Ammonium chloride Copper(II) sulfate Lead(II)chloride Potassium bromide Potassium chloride Sodium acetate Sodium chlorate 0◦ C 29.4 23.1 0.67 53.6 28.0 36.2 79.6 20◦ C 37.2 32.0 1.0 65.3 34.0 46.4 95.9 60◦ C 55.3 61.8 1.94 85.5 45.8 139 137 100◦ C 77.3 114 3.2 104 56.3 170.15 204 1. At 50◦ C how would you classify a solution of 58.2g of ammonium chloride? 2. How much sodium acetate would dissolve in 200g of water at 60◦ C? 3. Which of the compounds listed above is the least soluble in water at 0◦ C? 4. How would you classify a solution of 46.3g of sodium acetate at 20◦ C? 5. Which of the compounds above shows the least change in solubility from 0◦ C - 100◦C? 6. Which shows the most change? 7. Which of the above compounds is the most soluble at 100◦ C? 8. How many grams of NaClO3 will it take to form a saturated solution in 200g of water at 60◦ C? 9. How many grams of KBr will it take to form a saturated solution in 300g of water at 100◦ C?
