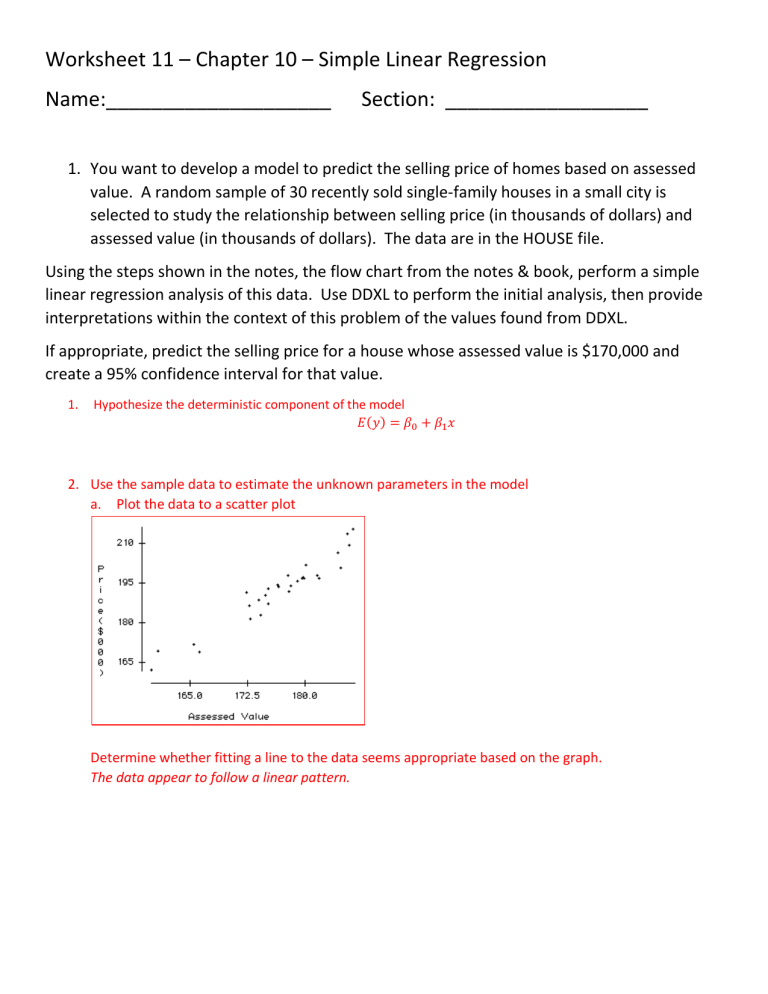
Worksheet 11 – Chapter 10 – Simple Linear Regression Name:____________________ Section: __________________ 1. You want to develop a model to predict the selling price of homes based on assessed value. A random sample of 30 recently sold single-family houses in a small city is selected to study the relationship between selling price (in thousands of dollars) and assessed value (in thousands of dollars). The data are in the HOUSE file. Using the steps shown in the notes, the flow chart from the notes & book, perform a simple linear regression analysis of this data. Use DDXL to perform the initial analysis, then provide interpretations within the context of this problem of the values found from DDXL. If appropriate, predict the selling price for a house whose assessed value is $170,000 and create a 95% confidence interval for that value. 1. Hypothesize the deterministic component of the model 𝐸𝐸(𝑦𝑦) = 𝛽𝛽0 + 𝛽𝛽1 𝑥𝑥 2. Use the sample data to estimate the unknown parameters in the model a. Plot the data to a scatter plot Determine whether fitting a line to the data seems appropriate based on the graph. The data appear to follow a linear pattern. b. Find the slope and interpret �1 = 1.78171 𝑠𝑠𝑠𝑠𝑠𝑠𝑠𝑠𝑠𝑠 = 𝛽𝛽 For every $1000 dollar increase in assessed value the asking price increases by 1.7817 (thousands of dollars) c. Find the y-intercept and interpret �0 = −122.344 𝑦𝑦 − 𝑖𝑖𝑖𝑖𝑖𝑖𝑖𝑖𝑖𝑖𝑖𝑖𝑖𝑖𝑖𝑖𝑖𝑖 = 𝛽𝛽 There is not a valid interpretation of y-intercept for this problems a house assessment value of $0 is in the scope of the data sampled or possible. d. Prediction equation: 𝑦𝑦� = −122.344 + 1.78171(𝐴𝐴𝐴𝐴𝐴𝐴𝐴𝐴𝐴𝐴𝐴𝐴𝐴𝐴𝐴𝐴 𝑉𝑉𝑉𝑉𝑉𝑉𝑉𝑉𝑉𝑉) 3. Specify the probability distribution of the random error term and estimate the standard deviation of this distribution a. Check assumptions of probability of random error i. The mean of ε (random error) is 0 ii. The variance of ε is constant iii. The probability distribution of ε is normal iv. ε's are independent of one another b. Find the value of variability of random error and interpret 𝑠𝑠 = 3.475 𝑠𝑠 = (3.475)2 = 12.0756 We expect approximately 95% of the observed values of selling price to lie within 2(3.475) = 6.95 thousand dollars of their respective least squares predicted selling price value. 2 4. Statistically evaluate the usefulness of the model a. Hypothesis Test for 𝛽𝛽1 Hypotheses: 𝐻𝐻0 : 𝛽𝛽1 = 0 𝐻𝐻𝐴𝐴 : 𝛽𝛽1 ≠ 0 Assumptions: (See step 3a above) Test: Test Statistic: t = 18.7 p-value ≤ 0.0001 Summary: At the 5% significance level, my p-value is less than alpha therefore reject H0. There is sufficient evidence to suggest that the population slope of the regression line predicting selling price ($1000) from assessed value ($1000) is different from 0. Our model is statistically useful b. Calculate coefficient of correlation (r) and interpret 𝑟𝑟 = √. 926 = 0.9623 There is a strong positive linear association between selling price ($1000) and assessed value ($1000). c. Calculate coefficient of determination (r2) and interpret 𝑟𝑟 2 = .926 About 92.6% of the sample variation in selling price ($1000) can be explained by using assessed value ($1000) to predict selling price in our linear model. d. Is the model practically useful? Since r2 is large and s is small relative to the possible values for y the model is practically useful. 5. Use the model for prediction, estimation a. Use line for prediction 𝑦𝑦� = −122.344 + 1.78171(𝐴𝐴𝐴𝐴𝐴𝐴𝐴𝐴𝐴𝐴𝐴𝐴𝐴𝐴𝐴𝐴 𝑉𝑉𝑉𝑉𝑉𝑉𝑉𝑉𝑉𝑉) 𝑦𝑦� = −122.344 + 1.78171(170) 𝑦𝑦� = 180.5467 𝑡𝑡ℎ𝑜𝑜𝑜𝑜𝑜𝑜𝑜𝑜𝑜𝑜𝑜𝑜 𝑑𝑑𝑑𝑑𝑑𝑑𝑑𝑑𝑑𝑑𝑑𝑑𝑑𝑑 b. Create Confidence Intervals for estimation and interpret We are 95% confident that the true mean selling price value for a house whose assessed value is $170,000 lies between $178,710 dollars and $182,390.

