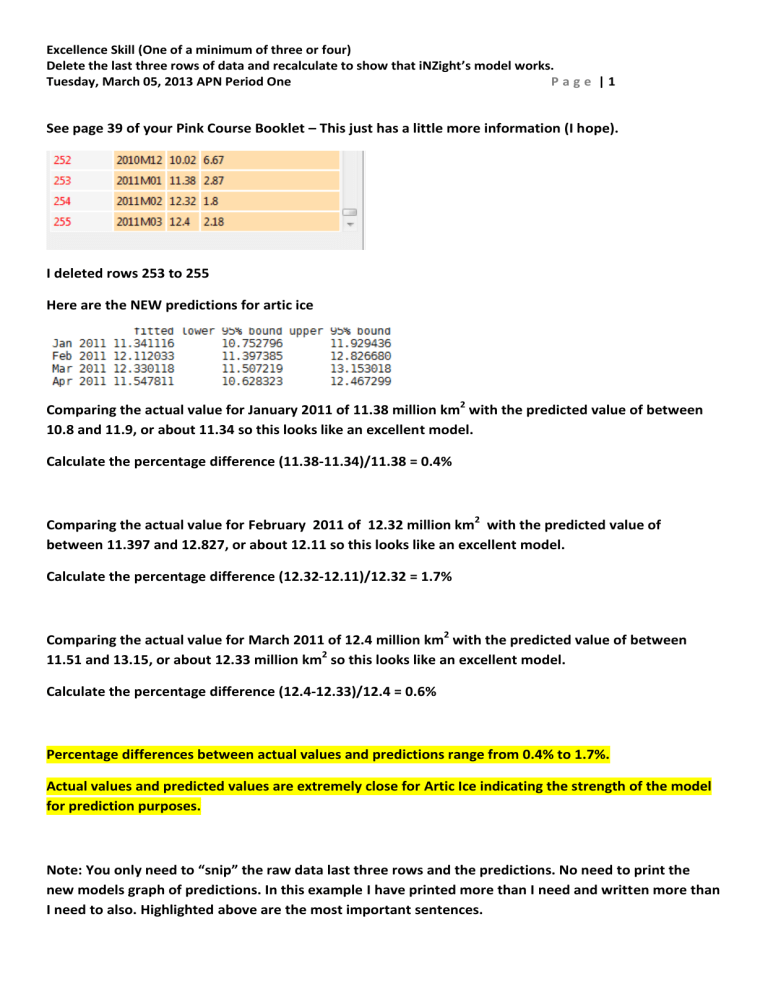
Excellence Skill (One of a minimum of three or four) Delete the last three rows of data and recalculate to show that iNZight’s model works. Tuesday, March 05, 2013 APN Period One Page |1 See page 39 of your Pink Course Booklet – This just has a little more information (I hope). I deleted rows 253 to 255 Here are the NEW predictions for artic ice Comparing the actual value for January 2011 of 11.38 million km2 with the predicted value of between 10.8 and 11.9, or about 11.34 so this looks like an excellent model. Calculate the percentage difference (11.38-11.34)/11.38 = 0.4% Comparing the actual value for February 2011 of 12.32 million km2 with the predicted value of between 11.397 and 12.827, or about 12.11 so this looks like an excellent model. Calculate the percentage difference (12.32-12.11)/12.32 = 1.7% Comparing the actual value for March 2011 of 12.4 million km2 with the predicted value of between 11.51 and 13.15, or about 12.33 million km2 so this looks like an excellent model. Calculate the percentage difference (12.4-12.33)/12.4 = 0.6% Percentage differences between actual values and predictions range from 0.4% to 1.7%. Actual values and predicted values are extremely close for Artic Ice indicating the strength of the model for prediction purposes. Note: You only need to “snip” the raw data last three rows and the predictions. No need to print the new models graph of predictions. In this example I have printed more than I need and written more than I need to also. Highlighted above are the most important sentences.


