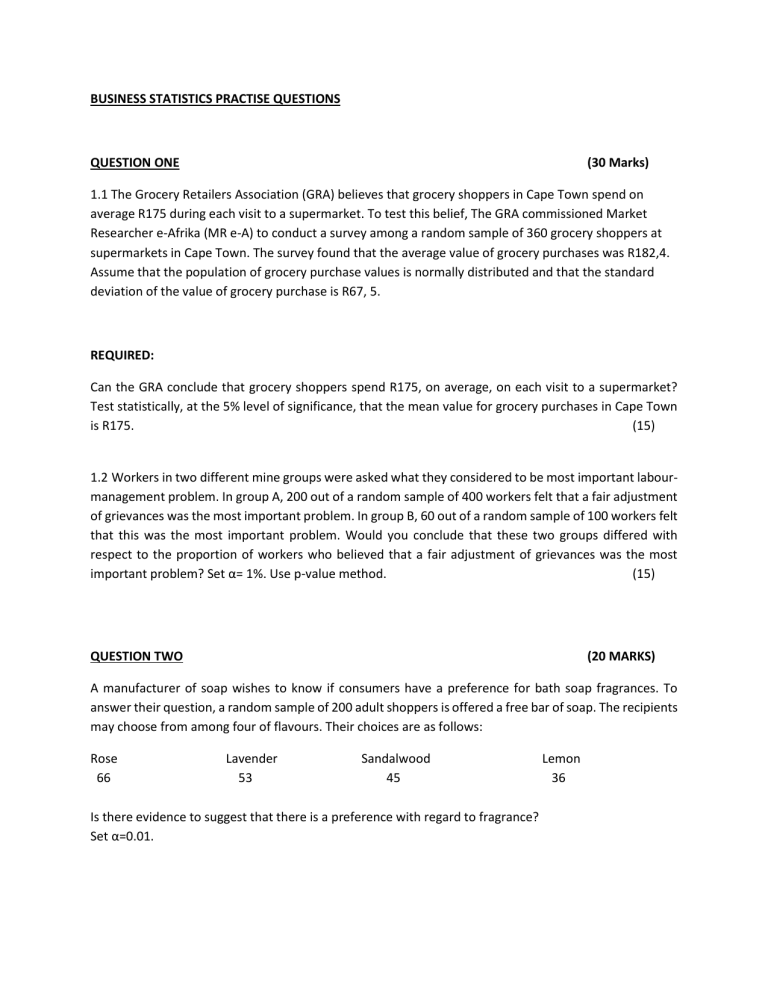
BUSINESS STATISTICS PRACTISE QUESTIONS QUESTION ONE (30 Marks) 1.1 The Grocery Retailers Association (GRA) believes that grocery shoppers in Cape Town spend on average R175 during each visit to a supermarket. To test this belief, The GRA commissioned Market Researcher e-Afrika (MR e-A) to conduct a survey among a random sample of 360 grocery shoppers at supermarkets in Cape Town. The survey found that the average value of grocery purchases was R182,4. Assume that the population of grocery purchase values is normally distributed and that the standard deviation of the value of grocery purchase is R67, 5. REQUIRED: Can the GRA conclude that grocery shoppers spend R175, on average, on each visit to a supermarket? Test statistically, at the 5% level of significance, that the mean value for grocery purchases in Cape Town is R175. (15) 1.2 Workers in two different mine groups were asked what they considered to be most important labourmanagement problem. In group A, 200 out of a random sample of 400 workers felt that a fair adjustment of grievances was the most important problem. In group B, 60 out of a random sample of 100 workers felt that this was the most important problem. Would you conclude that these two groups differed with respect to the proportion of workers who believed that a fair adjustment of grievances was the most important problem? Set α= 1%. Use p-value method. (15) QUESTION TWO (20 MARKS) A manufacturer of soap wishes to know if consumers have a preference for bath soap fragrances. To answer their question, a random sample of 200 adult shoppers is offered a free bar of soap. The recipients may choose from among four of flavours. Their choices are as follows: Rose 66 Lavender 53 Sandalwood 45 Is there evidence to suggest that there is a preference with regard to fragrance? Set α=0.01. Lemon 36 SUGGESTED SOLUTION QUESTION ONE Hypothesis testing 1.1 Step 1 H0:µ = 175 (15) H1:µ ≠ 175 A two-tailed hypothesis test. Step 2 α = 0.05, Step 3 Accept H0 if z-test falls within critical z-value -1.96 and +1.96 Step 4 x 182.4 175 2.08 Z critical = s 67.5 n 360 = 2.08 Step 5 Decision rule: Reject H0. 2.08 >+1.96 and hence lies outside the region of acceptance. Step 6 There is strong statistical evidence that the actual mean value of grocery purchases is not R175. 1.2 (15) Step 1 H0:π1=π2 H1:π1≠π P1=200/400 =0.5 P2=60/100=0.6 Steps2 α=0.10 Step 3 reject H0 if the z-test >1.64 or if the z-test < -1.64 (two-tailed test) Step 4: Z calc = p1 p 2 1 1 p q n1 n2 0.5 0.6 1 1 0.52(0.48) 400 100 1.79 = -1.79 Step 5 Reject H0 Step 6 There is significance evidence to conclude that the two groups differ in their belief QUESTION FOUR Step 1: (25) H0: there is no preference. H1: there is a preference in respect of flavour. Step 2: level of significance is 0.01 χ2critical value = 2 Step 3: ;d . f = 2 0.01;1 = 11.345 Do not reject H0 Reject H0 0.01 0 11.345 Step 4: Decision Rule Reject H0 if χ2 calc ˃ 11.345 Step 5: 2 O E 2 ; where E calc E O = observed frequency E = expected frequency Step 6: Flavour fo fe 2 x =∑ (𝑓𝑒 − 𝑓𝑒)2 fe Rose 66 50 5.12 Lavender 53 50 0.18 Sandalwood 45 50 0.50 Lemon 36 50 3.92 Total 200 200 9.72 Note: fe = row total x column total Sample size Where fe is expected frequency and fo is observed frequency. Step 5 Decision: 9.72 < 11.345 Step 6 Conclusion: Do not reject Ho. since 9.72 falls in the region of acceptance.
