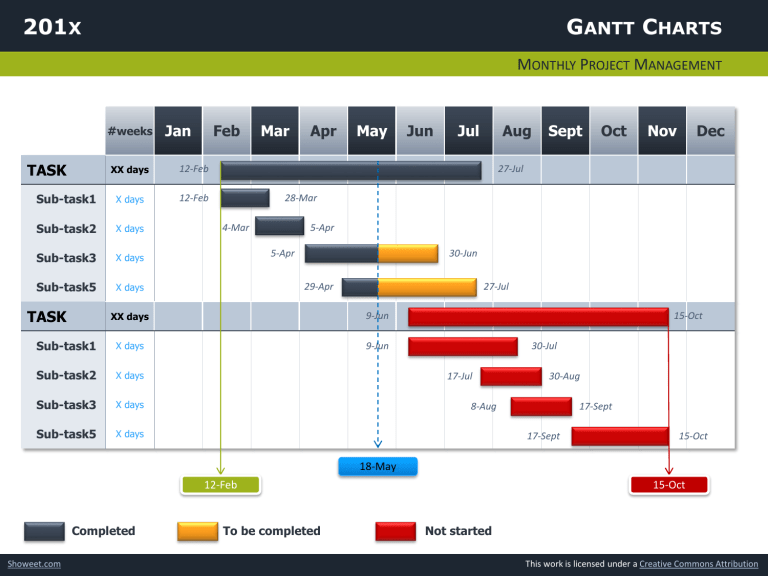
201X GANTT CHARTS MONTHLY PROJECT MANAGEMENT #weeks TASK Jan Feb XX days 12-Feb Sub-task1 X days 12-Feb Sub-task2 X days Sub-task3 X days Sub-task5 X days TASK Mar Apr May Jun Jul Aug Sept Oct Nov Dec 27-Jul 28-Mar 5-Apr 4-Mar 30-Jun 5-Apr 29-Apr 27-Jul XX days 9-Jun Sub-task1 X days 9-Jun Sub-task2 X days Sub-task3 X days Sub-task5 X days 15-Oct 30-Jul 17-Jul 30-Aug 8-Aug 17-Sept 17-Sept 15-Oct 18-May 12-Feb Completed Showeet.com To be completed 15-Oct Not started This work is licensed under a Creative Commons Attribution 201X GANTT CHARTS WEEKLY PROJECT MANAGEMENT #weeks TASK Week 1 Week 2 Week 3 Week 4 Week 5 Week 6 Week 7 Week 8 Week 9 Week 10 Week 11 Week 12 XX days Sub-task1 X days Sub-task2 X days Sub-task3 X days Sub-task5 X days TASK XX days Sub-task1 X days Sub-task2 X days Sub-task3 X days Sub-task5 X days Today Start Completed Showeet.com To be completed End Not started This work is licensed under a Creative Commons Attribution HOW TO USE IT? Use the 3 following images: Select your image above, crop it from the right or from the left according to your needs (and in order to keep the shaded effect of the bar graph) e.g., crop the image from the right to the left e.g., crop the image from the left to the right Showeet.com This work is licensed under a Creative Commons Attribution 201X GANTT CHARTS MONTHLY PROJECT MANAGEMENT #weeks TASK Jan Feb Mar Apr May Jun Jul Aug Sept Oct Nov Dec XX days 30-Jul 12-Feb Sub-task1 X days 12-Feb 28-Mar Sub-task2 X days 4-Mar 18-Apr Sub-task3 X days 8-Apr 30-Jun Sub-task5 X days 2-May 30-Jul TASK XX days 9-Jun 15-Oct Sub-task1 X days 9-Jun 30-Jul Sub-task2 X days 30-Aug 1-Jul Sub-task3 X days 1-Aug 1-Nov Sub-task5 X days 2-Sept 15-Oct Today Start Completed Showeet.com To be completed End Not started This work is licensed under a Creative Commons Attribution 201X GANTT CHARTS WEEKLY PROJECT MANAGEMENT #weeks TASK Week 1 Week 2 Week 3 Week 4 Week 5 Week 6 Week 7 Week 8 Week 9 Week 10 Week 11 Week 12 XX days Sub-task1 X days Sub-task2 X days Sub-task3 X days Sub-task5 X days TASK XX days Sub-task1 X days Sub-task2 X days Sub-task3 X days Sub-task5 X days 18-May 12-Feb Completed Showeet.com To be completed 15-Oct Not started This work is licensed under a Creative Commons Attribution HOW TO USE IT? The horizontal bar graph is made of black text squares (Insert -> Symbol) within the cells of the tab: “Webdings” font, character code: “103” Weekly Gantt: Week 5 Week 6 Week 7 5 1 cell = 1 week = colored symbols (i.e. 1 per day of the week) E.g. for week 7: 3 first squares with dark blue color, the 2 last with color of the background (here: light blue) Monthly Gantt: 1 cell = 1 month = 4 colored symbols (i.e. 1 Feb Mar per week of the month) E.g. for February: 2 first squares with color of the background, the 2 last with dark blue color Showeet.com This work is licensed under a Creative Commons Attribution Conditions of use You can use this PowerPoint diagram for your personal, educational and business presentations. With the use of this free diagram you accept the following use and license conditions. You are free: To Share — to copy, distribute and transmit the work Under the following conditions: Attribution — You must attribute the work in the manner specified by the author or licensor (but not in any way that suggests that they endorse you or your use of the work). No Derivative Works — You may not alter, transform, or build upon this work. In no event shall showeet.com be liable for any indirect, special or consequential damages arising out of or in connection with the use of the map. http://www.showeet.com This work is licensed under the Creative Commons Attribution-NoDerivs 3.0 Unported License. To view a copy of this license, visit http://creativecommons.org/licenses/by-nd/3.0/ or send a letter to Creative Commons, 444 Castro Street, Suite 900, Mountain View, California, 94041, USA.
