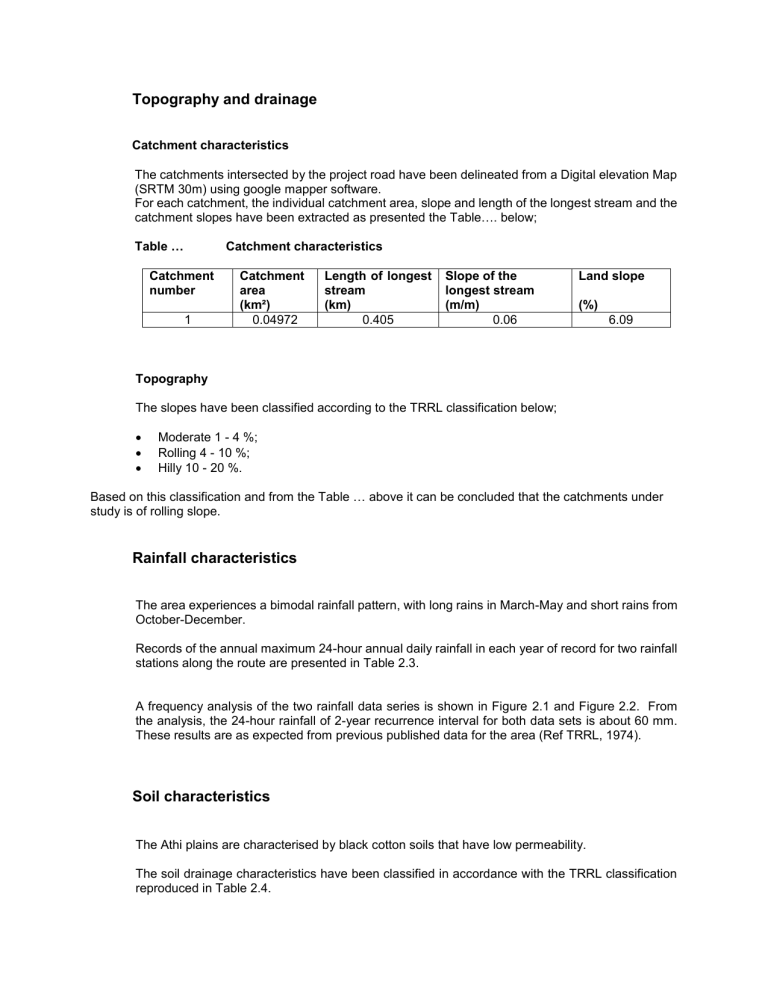
Topography and drainage Catchment characteristics The catchments intersected by the project road have been delineated from a Digital elevation Map (SRTM 30m) using google mapper software. For each catchment, the individual catchment area, slope and length of the longest stream and the catchment slopes have been extracted as presented the Table…. below; Table … Catchment characteristics Catchment number 1 Catchment area (km²) 0.04972 Length of longest stream (km) 0.405 Slope of the longest stream (m/m) 0.06 Land slope (%) 6.09 Topography The slopes have been classified according to the TRRL classification below; Moderate 1 - 4 %; Rolling 4 - 10 %; Hilly 10 - 20 %. Based on this classification and from the Table … above it can be concluded that the catchments under study is of rolling slope. Rainfall characteristics The area experiences a bimodal rainfall pattern, with long rains in March-May and short rains from October-December. Records of the annual maximum 24-hour annual daily rainfall in each year of record for two rainfall stations along the route are presented in Table 2.3. A frequency analysis of the two rainfall data series is shown in Figure 2.1 and Figure 2.2. From the analysis, the 24-hour rainfall of 2-year recurrence interval for both data sets is about 60 mm. These results are as expected from previous published data for the area (Ref TRRL, 1974). Soil characteristics The Athi plains are characterised by black cotton soils that have low permeability. The soil drainage characteristics have been classified in accordance with the TRRL classification reproduced in Table 2.4. We have classified the soil in this study as slightly impeded. Table 2.4 Soil permeability classification. Soil class Impeded Description Very low permeability. Clay soils with high swelling potential. Shallow soils over largely impermeable layer, very high water table. Slightly impeded Low permeability. Drainage slightly impeded when soil fully wetted. Well drained Very permeable. Soil with very high infiltration rates such as sands, gravels and aggregated clays. Source: TRRL Laboratory Report 706, Transport and Road Research Laboratory, Department of Environment, UK, 1976. Land use characteristics The type of vegetation cover and land use affects the runoff by controlling the volume and hydrograph base time, and hence the peak flow. Between Embakasi and Athi River town there are commercial and industrial developments adjacent to the road. HYDROLOGICAL ANALYSIS Modified Rational Formula The Modified Rational Formula method is commonly used for flood prediction for ungauged catchments in East Africa. The inherent assumptions in the method are that the design storm produces uniform rainfall intensity over the entire catchment and that the relationship between rainfall intensity and rate of runoff is a constant for a particular catchment. The formula used for the calculation of the flood is: Q = 0.278 C I A Q C I A = = = = peak discharge at catchment outlet in m 3/s; runoff coefficient; rainfall intensity in mm/hr during the time of concentration; catchment area in km2. Where: The time of concentration is the time taken for water to travel from the remotest part of the catchment to the point of outlet. The Kirpich formula is widely used for calculation of the time of concentration. The formula is: Tc = Where: Tc L s = = = = 0.87L2 1000s 0.385 Time of concentration in hrs; Length of main stream in km; Slope of main stream. 0.87(0.405)2 = = 1000(0.06) 0.09742hrs The runoff coefficient, C, is a function of land slope, soil permeability, and vegetation cover within the catchment. The application of the model requires the selection of a range of parameters for each catchment which include: Standard contributing area coefficient Cs - the standard runoff factor for a wet zone grassed catchment. The coefficient varies with soil type and average catchment slope. The land use factor CL - this factor adjusts the runoff factor according to land usage relative to a catchment with short grass cover. The catchment wetness factor Cw - a measure of the antecedent wetness of the catchment. The values of the catchment parameters are obtained from table 4, 5 and 6 of the TRRL Laboratory Report 706, Transport and Research Laboratory Department of Environment, UK, 1976. 𝐶𝑎 = = = 𝐶𝑠 ∗ 𝐶𝑊 ∗ 𝐶𝑙 0.1 * 1.0 * 1.5 0.15 The intensity of rainfall, for use in flood prediction is calculated using the TRRL Laboratory Report 6231 “The Prediction of Storm Rainfall in East Africa”. The equation used for calculation of the rainfall intensity, I, is given below: 1 TRRL Laboratory Report 623, Transport and Road Research Laboratory, Department of Environment, UK, 1974 I = 1 24.33 24 T 0.33 ARF x Rd x n Where: I = rainfall intensity in mm/hr; ARF = Area reduction factor; Rd = 24 hr storm rainfall in mm derived from Appendix 1 Fig1 of the TRRL Laboratory Report 623,1974; T = Time of Concentration in Rational formula or Base Time in EAFM. n is a value derived from Table 9 of TRRL report. The areal reduction factor for each catchment is calculated using the following equation: ARF = 1-0.04(T)-1/3A1/2 = = Area reduction factor; Area of catchment in km². Where: ARF A −1 1 1−0.04(0.02740 3 )∗ 0.049722 Therefore, ARF = = I = = 0.9728 0.9728 * 60 * ( 1 1 ( 24.33 24 0.02740+0.33 135.0413mm/hr )) ^0.96 From the Rational Method of Runoff calculation; Q2 = 0.278 CIA * ARF = 0.278 * 0.15 * 135.0413 * 0.04972 * 0.9728 = 0.2462m3/s The 10:2 year ratios for the various return periods are obtained from Figure 5 of the TRRL Laboratory Report 623, 1974 and multiplied with Q2 to give the peak discharge. In this case we designed the drains based on a 10 year return period hence a 10:2 flood ratio of 2.62 was applied to give a peak discharge of; Q10 = 0.2462 * 2.62 = 0.460321m3/s Formula Used for Drain / Culvert Discharge: Mannings formula for flow velocity V; V = 1 R2/3 S1/2 where V = velocity of flow in m/s : range = 0.75 – 6 m/s n n = coefficient of roughness R = hydraulic radius = A (x-sec. area) / P (wet perimeter.) S = gradient (slope) m/m Area of channel = Q/V where Q = Storm discharge The size of the culverts Channels was computed using the above Mannings formula for computed design storm frequency return flows. Materials The type of pipe culverts, channels and IBD commonly used in Kenya are of the standard precast concrete materials. The choice of channel material to be adopted for any given case will take into account unit cost durability site conditions and overall maintenance requirements. The manufacturing specifications of the types of drainage channels suitable for the project area are detailed in the standards given in the table below Table 8.1: PCC Channels Manufacturing Standards Type of Channel Standard PCC pipe culvert BSS 5911 Part 1 and 3 Flow Velocity in Storm water Channels In order to minimize scouring of storm water drainage channels and reduce deposition of debris in the channels the minimum and maximum flow velocities considered in the design were 0.3m/s to 5m/s.


