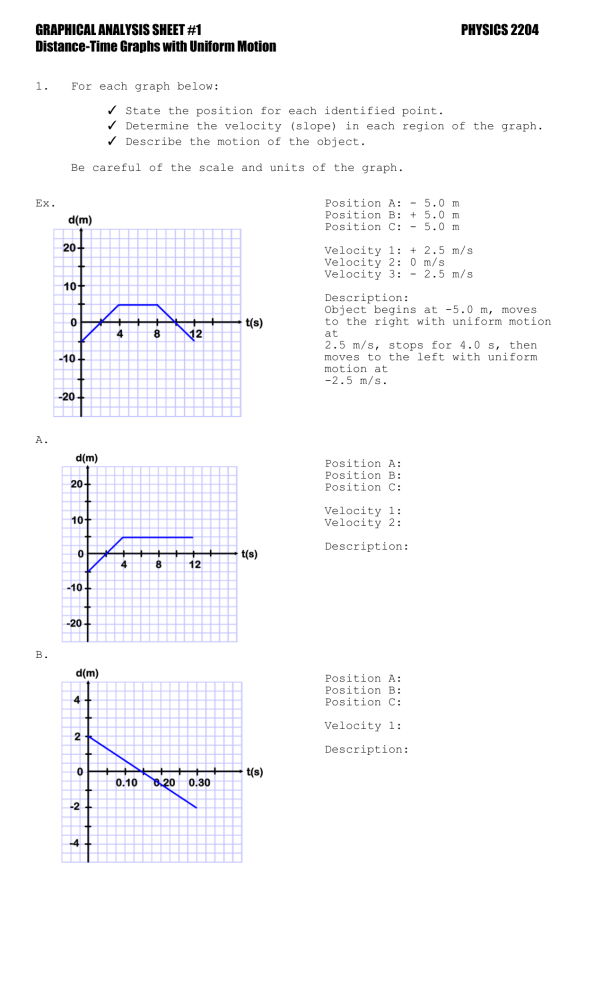
GRAPHICAL ANALYSIS SHEET #1 Distance-Time Graphs with Uniform Motion 1. PHYSICS 2204 For each graph below: ✓ State the position for each identified point. ✓ Determine the velocity (slope) in each region of the graph. ✓ Describe the motion of the object. Be careful of the scale and units of the graph. Ex. Position A: - 5.0 m Position B: + 5.0 m Position C: - 5.0 m Velocity 1: + 2.5 m/s Velocity 2: 0 m/s Velocity 3: - 2.5 m/s Description: Object begins at -5.0 m, moves to the right with uniform motion at 2.5 m/s, stops for 4.0 s, then moves to the left with uniform motion at -2.5 m/s. A. Position A: Position B: Position C: Velocity 1: Velocity 2: Description: B. Position A: Position B: Position C: Velocity 1: Description: C. Position A: Position B: Position C: Velocity 1: Velocity 2: Description: D. Position A: Position B: Position C: Velocity 1: Description: E. Position A: Position B: Position C: Velocity 1: Velocity 2: Velocity 3: Description: F. Position A: Position B: Position C: Velocity 1: Description: 2. Sketch the following d-t graphs on grid paper. A. B. C. D. E. F. An An An An An An object object object object object object stopped. moving to the right with uniform motion. moving to the left with uniform motion. stops for 3.0 s and then moves right at 2.0 m/s. starts at -2.0 m and moves +2.0 m in 5.0s. moves from +3.0 m to -2.0 m at -1.0 m/s and then stops.

