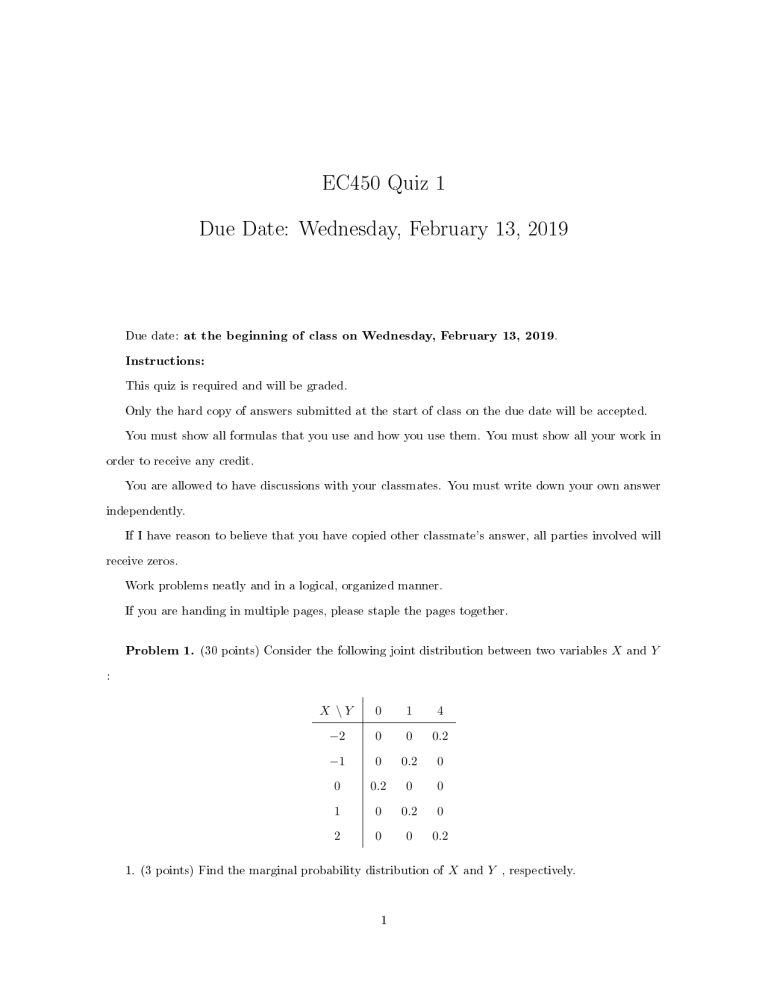
EC450 Quiz 1 Due Date: Wednesday, February 13, 2019 Due date: . at the beginning of class on Wednesday, February 13, 2019 Instructions: This quiz is required and will be graded. Only the hard copy of answers submitted at the start of class on the due date will be accepted. You must show all formulas that you use and how you use them. You must show all your work in order to receive any credit. You are allowed to have discussions with your classmates. You must write down your own answer independently. If I have reason to believe that you have copied other classmate's answer, all parties involved will receive zeros. Work problems neatly and in a logical, organized manner. If you are handing in multiple pages, please staple the pages together. Problem 1. (30 points) Consider the following joint distribution between two variables X and Y : X \Y 0 1 4 −2 0 0 0.2 −1 0 0.2 0 0 0.2 0 0 1 0 0.2 0 2 0 0 0.2 1. (3 points) Find the marginal probability distribution of X and Y , respectively. 1 EC450 Applied Econometrics Spring 2019 2. (3 points) Find the expected value of X and Y , respectively. 3. (5 points) Calculate the covariance between X and Y . 4. (3 points) Find the conditional distribution of Y for X = 1. 5. (6 points) Calculate E(Y |X) for for X = −2,X = −1, X = 0, X = 1, and X = 2, respectively. 6. (5 points) In view of part 5, would you say Y is dependent of X ? 7. (5 points) In view of part 3, would you say Y is uncorrelated to X ? Problem 2. (70 points) You have $10 thousand saved up to invest for a year, and are considering stocks and/or short-term Treasury bills. The returns (in %) from both sources are judged uncertain, of course, as the following joint probability Table 1 indicates: Table 1: Joint probability table for S (in %) and (in %) Return on Stock (S) Return on Treasury Bill (T) -10 0 10 20 5 0 0 0.15 0.05 8 0 0.1 0.25 0.25 12 0.1 0.1 0 0 1. (5 points) Calculate the expected returns from stock and treasury bill, i.e., E(S) =? and E(T ) =? Which strategy leads to a higher expected return, investing in stock or investing in treasury bill? 2. (5 points) Calculate the variances of both returns, i.e., V ar(S) =? and V ar(T ) =? Which strategy is more risky, investing in stock or investing in treasury bill? 3. (5 points) Calculate the co-variance between the two returns (both are in unit of %), i.e., Cov(S, T ) =? 4. (5 points) What is the correlation coecient between Stock return S and T-bill return T , i.e., ρST =? Now both returns are expressed in decimals, not in percentage anymore. The joint probability distribution table becomes the following Table 2: Table 2: Joint probability table for S and T 2 EC450 Applied Econometrics Spring 2019 Return on Stock (S) Return on Treasury Bill (T) -0.1 0 0.1 0.2 0.05 0 0 0.15 0.05 0.08 0 0.1 0.25 0.25 0.12 0.1 0.1 0 0 5. (5 points) Use Table 2 to calculate the expected returns from stock and treasury bill, i.e., E(S) =? and E(T ) =? How are the two expected returns related to the two expected returns you nd in part 1. 6. (5 points) Use Table 2 to calculate the variances of both returns, i.e., V ar(S) =? and V ar(T ) =? How are the two variances related to the two variances you nd in part 2. 7. (5 points) Use Table 2 to calculate the co-variance between the two returns , i.e., Cov(S, T ) =? How is the co-variance related to the co-variance you nd in part 3. 8. (5 points) Use Table 2 to nd correlation coecient between Stock return S and T-bill return T , i.e., ρST =? Are the two correlation coecients, in part 4 and part 8, identical? Use Table 2 to answer following questions: 9. (5 points) If you invested your $10 thousand entirely in stocks, what would be the expected value of your return? What is the variance? In other words, nd out E[10 ∗ (1 + S)] and V ar[10 ∗ (1 + S)], respectively. 10. (5 points) If you invested your $10 thousand entirely in treasury bills, what would be the expected value of your return? What is the variance? In other words, nd out E[10 ∗ (1 + T )] and V ar[10 ∗ (1 + T )] respectively. 11. (5 points) If you split your investment 50-50, invest $5 thousand in stocks and the other $5 thousand in treasury bills. What would be the return you expect? What is the variance? In other words, nd out E[5 ∗ (1 + S) + 5 ∗ (1 + T )] and V ar[5 ∗ (1 + S) + 5 ∗ (1 + T )], respectively. 12. (5 points) If you split your investment 80-20, i.e. investing $8 thousand in stocks and the rest $2 thousand in treasury bills. What are the expected return and its variance, respectively? In other words, nd out E[8 ∗ (1 + S) + 2 ∗ (1 + T )] and V ar[8 ∗ (1 + S) + 2 ∗ (1 + T )], respectively. 13. (5 points) If you split your investment w-(1 − w), invest w ∗ 10 thousand in stock and other (1 − w) ∗ 10 in treasury bills, where w is a fraction between 0 and 1. The return on your investment is 3 EC450 Applied Econometrics Spring 2019 R = w ∗ 10 ∗ (1 + S) + (1 − w) ∗ 10 ∗ (1 + T ) = 10 + w ∗ 10 ∗ S + (1 − w) ∗ 10 ∗ T What would be the return you expect? What is the variance? In other words, nd out E[10 + w ∗ 10 ∗ S + (1 − w) ∗ 10 ∗ T ] and V ar[10 + w ∗ 10 ∗ S + (1 − w) ∗ 10 ∗ T ], respectively. 14. (5 points) What is the value of w that minimizes the variance V ar[w ∗ 10 ∗ (1 + S) + (1 − w) ∗ 10 ∗ (1 + T )]? (Hint: you can solve this by algebra, or calculus, or plot V ar over w in Excel.) 4


