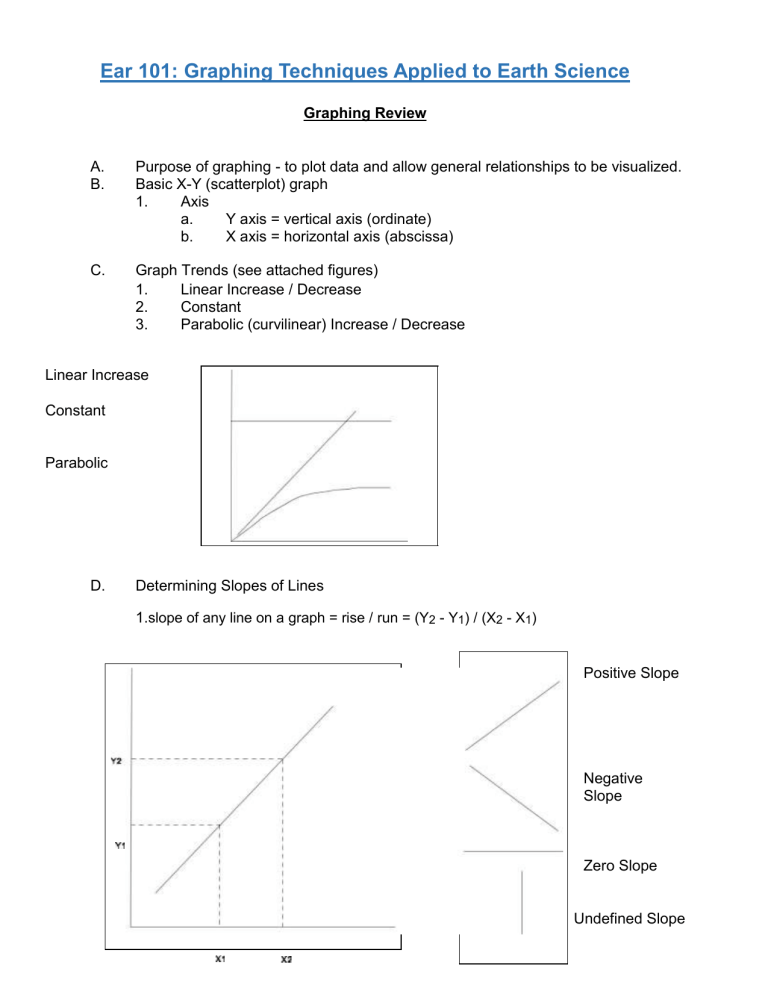
Ear 101: Graphing Techniques Applied to Earth Science Graphing Review A. B. Purpose of graphing - to plot data and allow general relationships to be visualized. Basic X-Y (scatterplot) graph 1. Axis a. Y axis = vertical axis (ordinate) b. X axis = horizontal axis (abscissa) C. Graph Trends (see attached figures) 1. Linear Increase / Decrease 2. Constant 3. Parabolic (curvilinear) Increase / Decrease Linear Increase Constant Parabolic D. Determining Slopes of Lines 1.slope of any line on a graph = rise / run = (Y2 - Y1) / (X2 - X1) Positive Slope Negative Slope Zero Slope Undefined Slope Overview of Graph Types A. B. C. D. X-Y Scatterplot Graphs 1. linear axes 2. log-linear axes 3. log-log axes Bar Graphs Triangular Graphs (three end-member composition plots) Polar-Azimuthal Graphs (directional scatter plots) Example Linear Graph Y = 2X + 4 60 50 40 30 20 10 0 0 5 10 15 20 25 Web Hits Per Month 15000 Expected Hits > 13000 10000 5000 0 Jan-98 Example Bar Graph Jul-98 Jan-99 Jul-99 Jan-00 Jul-00 Jan-01 Log Fit Polynomial Fit Linear Fit In Class Exercise: 1. Create a climatograph using the following information for Northport, NY. Located at about 40.90°N 73.35°W. Height about 6m / 19 feet above sea level. Average Temperature Jan Feb Mar Apr May Jun Jul Aug Sep Oct Nov Dec Year °F 30.7 32.0 39.7 49.3 59.2 68.2 73.4 72.7 66.2 55.9 46.4 36.0 52.3


